正在加载图片...
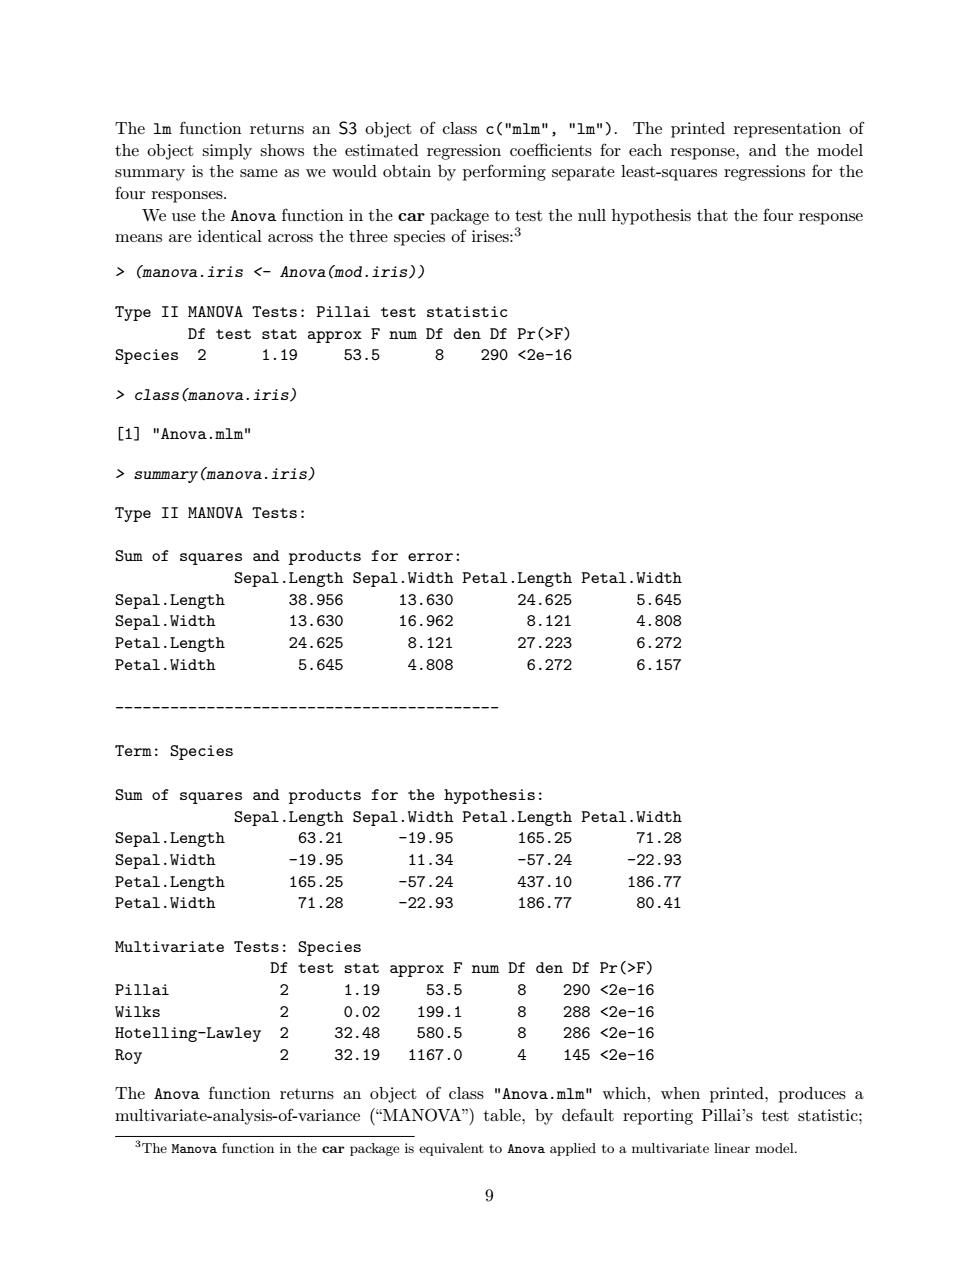
The lm function returns an S3 object of class c("mlm","Im").The printed representation of the object simply shows the estimated regression coefficients for each response,and the model summary is the same as we would obtain by performing separate least-squares regressions for the four responses. We use the Anova function in the car package to test the null hypothesis that the four response means are identical across the three species of irises:3 >(manova.iris <-Anova(mod.iris)) Type II MANOVA Tests:Pillai test statistic Df test stat approx F num Df den Df Pr(>F) Species 2 1.19 53.5 8290<2e-16 class(manova.iris) [1]"Anova.mlm" summary(manova.iris) Type II MANOVA Tests: Sum of squares and products for error: Sepal.Length Sepal.Width Petal.Length Petal.Width Sepal.Length 38.956 13.630 24.625 5.645 Sepal.Width 13.630 16.962 8.121 4.808 Petal.Length 24.625 8.121 27.223 6.272 Petal.Width 5.645 4.808 6.272 6.157 Term:Species Sum of squares and products for the hypothesis: Sepal.Length Sepal.Width Petal.Length Petal.Width Sepal.Length 63.21 -19.95 165.25 71.28 Sepal.Width -19.95 11.34 -57.24 -22.93 Petal.Length 165.25 -57.24 437.10 186.77 Petal.Width 71.28 -22.93 186.77 80.41 Multivariate Tests:Species Df test stat approx F num Df den Df Pr(>F) Pillai 2 1.19 53.5 8 290<2e-16 Wilks 2 0.02 199.1 8 288<2e-16 Hotelling-Lawley 2 32.48 580.5 8 286<2e-16 Roy 2 32.19 1167.0 4 145<2e-16 The Anova function returns an object of class "Anova.mlm"which,when printed,produces a multivariate-analysis-of-variance ("MANOVA")table,by default reporting Pillai's test statistic; 3The Manova function in the car package is equivalent to Anova applied to a multivariate linear model. 9The lm function returns an S3 object of class c("mlm", "lm"). The printed representation of the object simply shows the estimated regression coefficients for each response, and the model summary is the same as we would obtain by performing separate least-squares regressions for the four responses. We use the Anova function in the car package to test the null hypothesis that the four response means are identical across the three species of irises:3 > (manova.iris <- Anova(mod.iris)) Type II MANOVA Tests: Pillai test statistic Df test stat approx F num Df den Df Pr(>F) Species 2 1.19 53.5 8 290 <2e-16 > class(manova.iris) [1] "Anova.mlm" > summary(manova.iris) Type II MANOVA Tests: Sum of squares and products for error: Sepal.Length Sepal.Width Petal.Length Petal.Width Sepal.Length 38.956 13.630 24.625 5.645 Sepal.Width 13.630 16.962 8.121 4.808 Petal.Length 24.625 8.121 27.223 6.272 Petal.Width 5.645 4.808 6.272 6.157 ------------------------------------------ Term: Species Sum of squares and products for the hypothesis: Sepal.Length Sepal.Width Petal.Length Petal.Width Sepal.Length 63.21 -19.95 165.25 71.28 Sepal.Width -19.95 11.34 -57.24 -22.93 Petal.Length 165.25 -57.24 437.10 186.77 Petal.Width 71.28 -22.93 186.77 80.41 Multivariate Tests: Species Df test stat approx F num Df den Df Pr(>F) Pillai 2 1.19 53.5 8 290 <2e-16 Wilks 2 0.02 199.1 8 288 <2e-16 Hotelling-Lawley 2 32.48 580.5 8 286 <2e-16 Roy 2 32.19 1167.0 4 145 <2e-16 The Anova function returns an object of class "Anova.mlm" which, when printed, produces a multivariate-analysis-of-variance (“MANOVA”) table, by default reporting Pillai’s test statistic; 3The Manova function in the car package is equivalent to Anova applied to a multivariate linear model. 9