正在加载图片...
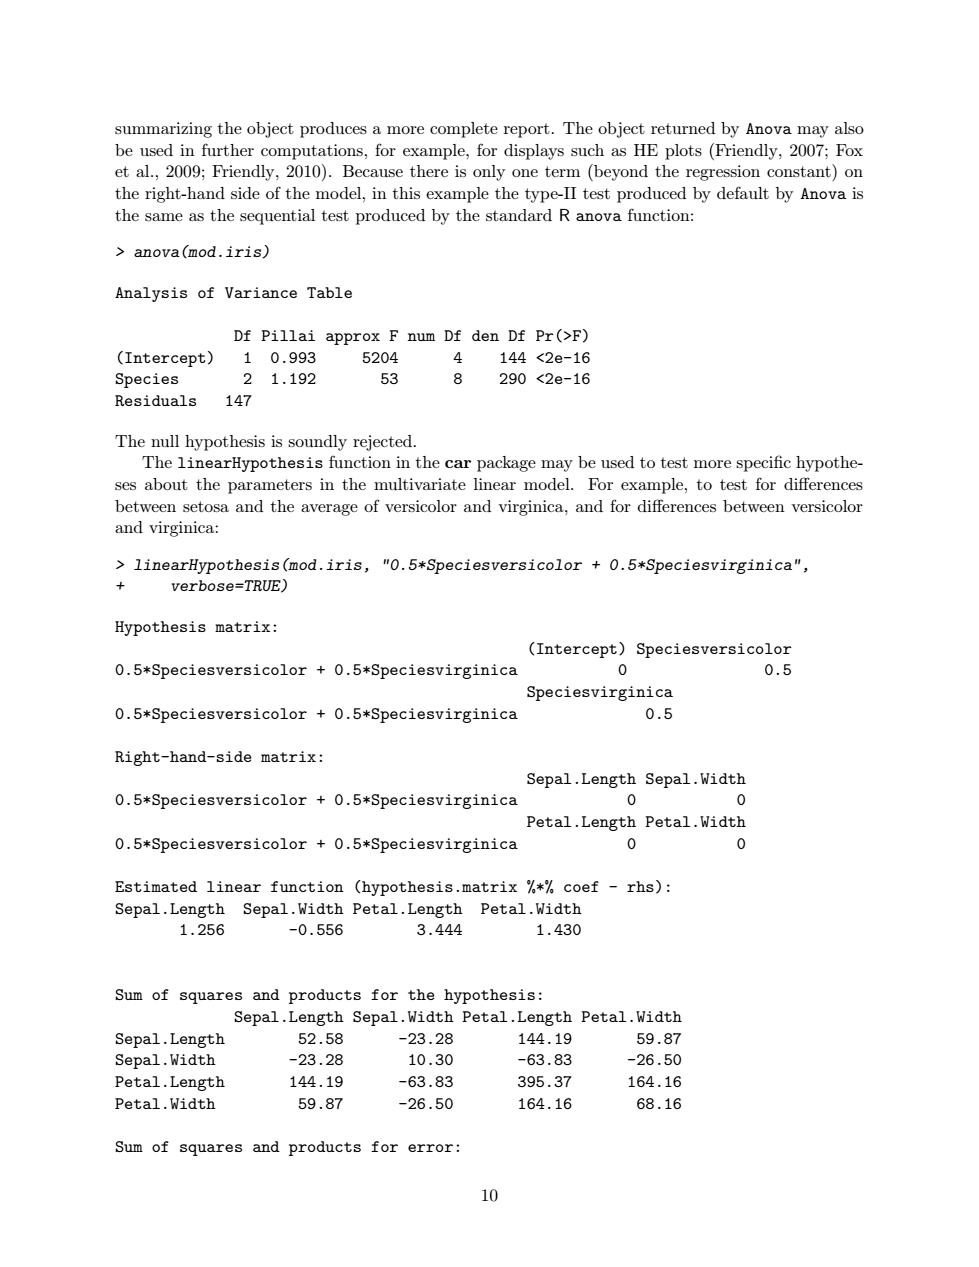
summarizing the object produces a more complete report.The object returned by Anova may also be used in further computations,for example,for displays such as HE plots (Friendly,2007;Fox et al.,2009;Friendly,2010).Because there is only one term (beyond the regression constant)on the right-hand side of the model,in this example the type-II test produced by default by Anova is the same as the sequential test produced by the standard R anova function: anova(mod.iris) Analysis of Variance Table Df Pillai approx F num Df den Df Pr(>F) (Intercept) 10.993 5204 4144<2e-16 Species 21.192 53 8 290<2e-16 Residuals 147 The null hypothesis is soundly rejected. The linearHypothesis function in the car package may be used to test more specific hypothe- ses about the parameters in the multivariate linear model.For example,to test for differences between setosa and the average of versicolor and virginica,and for differences between versicolor and virginica: linearHypothesis(mod.iris,"0.5*Speciesversicolor 0.5*Speciesvirginica", + verbose=TRUE) Hypothesis matrix: (Intercept)Speciesversicolor 0.5*Speciesversicolor 0.5*Speciesvirginica 0 0.5 Speciesvirginica 0.5*Speciesversicolor +0.5*Speciesvirginica 0.5 Right-hand-side matrix: Sepal.Length Sepal.Width 0.5*Speciesversicolor +0.5*Speciesvirginica 0 0 Petal.Length Petal.Width 0.5*Speciesversicolor +0.5*Speciesvirginica 0 0 Estimated linear function (hypothesis.matrix %*coef -rhs): Sepal.Length Sepal.Width Petal.Length Petal.Width 1.256 -0.556 3.444 1.430 Sum of squares and products for the hypothesis: Sepal.Length Sepal.Width Petal.Length Petal.Width Sepal.Length 52.58 -23.28 144.19 59.87 Sepal.Width -23.28 10.30 -63.83 -26.50 Petal.Length 144.19 -63.83 395.37 164.16 Petal.Width 59.87 -26.50 164.16 68.16 Sum of squares and products for error: 10summarizing the object produces a more complete report. The object returned by Anova may also be used in further computations, for example, for displays such as HE plots (Friendly, 2007; Fox et al., 2009; Friendly, 2010). Because there is only one term (beyond the regression constant) on the right-hand side of the model, in this example the type-II test produced by default by Anova is the same as the sequential test produced by the standard R anova function: > anova(mod.iris) Analysis of Variance Table Df Pillai approx F num Df den Df Pr(>F) (Intercept) 1 0.993 5204 4 144 <2e-16 Species 2 1.192 53 8 290 <2e-16 Residuals 147 The null hypothesis is soundly rejected. The linearHypothesis function in the car package may be used to test more specific hypotheses about the parameters in the multivariate linear model. For example, to test for differences between setosa and the average of versicolor and virginica, and for differences between versicolor and virginica: > linearHypothesis(mod.iris, "0.5*Speciesversicolor + 0.5*Speciesvirginica", + verbose=TRUE) Hypothesis matrix: (Intercept) Speciesversicolor 0.5*Speciesversicolor + 0.5*Speciesvirginica 0 0.5 Speciesvirginica 0.5*Speciesversicolor + 0.5*Speciesvirginica 0.5 Right-hand-side matrix: Sepal.Length Sepal.Width 0.5*Speciesversicolor + 0.5*Speciesvirginica 0 0 Petal.Length Petal.Width 0.5*Speciesversicolor + 0.5*Speciesvirginica 0 0 Estimated linear function (hypothesis.matrix %*% coef - rhs): Sepal.Length Sepal.Width Petal.Length Petal.Width 1.256 -0.556 3.444 1.430 Sum of squares and products for the hypothesis: Sepal.Length Sepal.Width Petal.Length Petal.Width Sepal.Length 52.58 -23.28 144.19 59.87 Sepal.Width -23.28 10.30 -63.83 -26.50 Petal.Length 144.19 -63.83 395.37 164.16 Petal.Width 59.87 -26.50 164.16 68.16 Sum of squares and products for error: 10