正在加载图片...
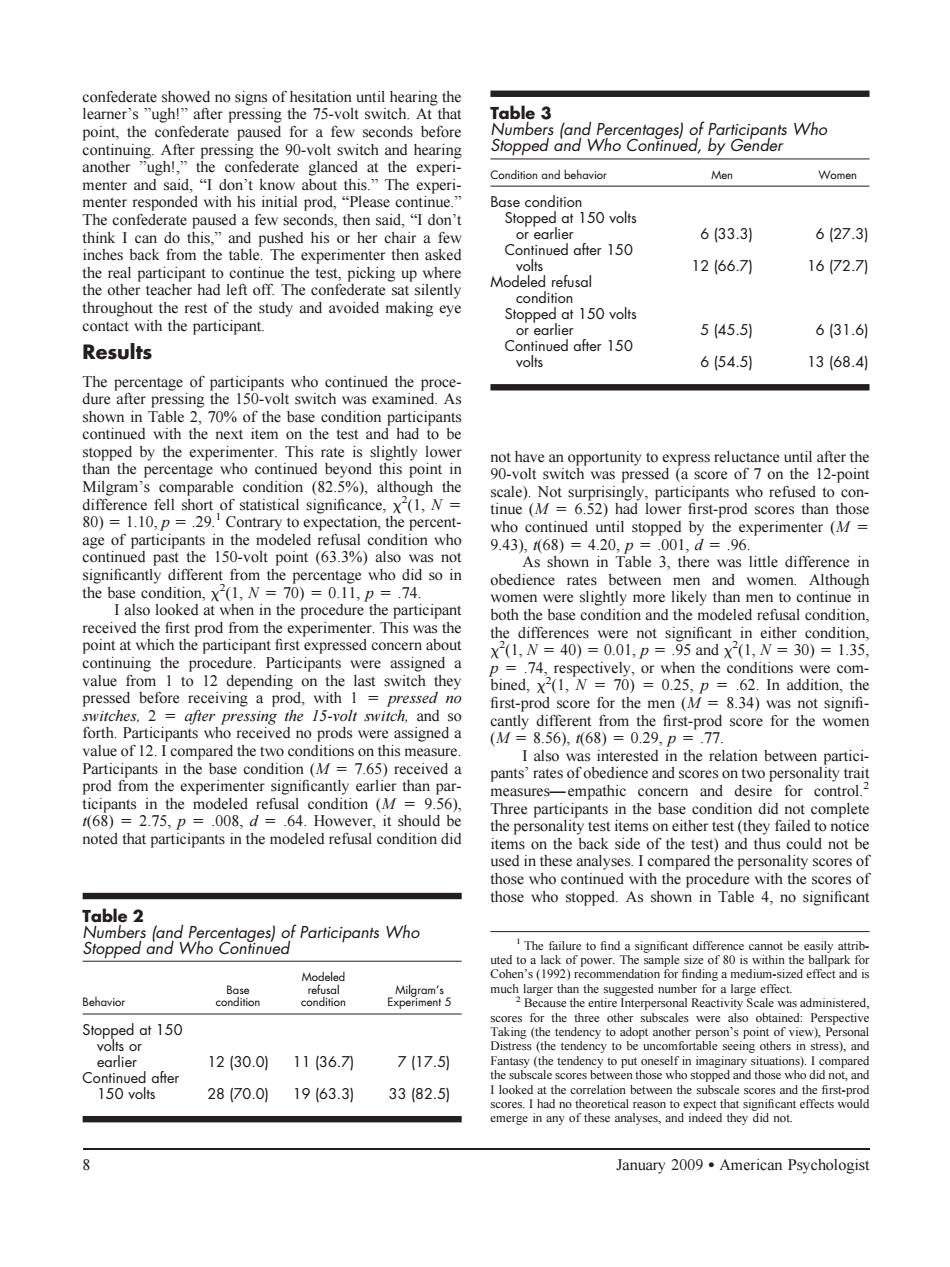
after pressing the tha pressing the -volt switch and hearing ter and said. exper Me responded with his initial pro do this.” 633.3 6(27.31 The experimente r then Modeled refusal 1266.7 1672.7 toehotepntndaoitdakigoc 545.5 631.6 Results 654.5 1368.4 shown in Table 70%of the ba lowe percentag e who continu con stopped by( 9436on40i配 the bas conditio 7001 74 obedience rates also looked nin the procedure the both the base the teldeneCo not si 135 74 or when the c nditions ere con 70)=02 In addition,th forth Pa ed a om the first-p rod score for the women on this measur 56),68 ed in the n2senogefaandioa the base con did noted that participants in the modeled refusal condition did testit ms either test Table 2 ooindagn of 80 is and Milgrom' Stopped at 150 hors in 1230.0j1136.7刀 717.5) (the to put tions).I ed after 150 volts 2870.011963.3) 33(82.5) that y of th y did no January 2009.American Psychologistconfederate showed no signs of hesitation until hearing the learner’s ”ugh!” after pressing the 75-volt switch. At that point, the confederate paused for a few seconds before continuing. After pressing the 90-volt switch and hearing another ”ugh!,” the confederate glanced at the experimenter and said, “I don’t know about this.” The experimenter responded with his initial prod, “Please continue.” The confederate paused a few seconds, then said, “I don’t think I can do this,” and pushed his or her chair a few inches back from the table. The experimenter then asked the real participant to continue the test, picking up where the other teacher had left off. The confederate sat silently throughout the rest of the study and avoided making eye contact with the participant. Results The percentage of participants who continued the procedure after pressing the 150-volt switch was examined. As shown in Table 2, 70% of the base condition participants continued with the next item on the test and had to be stopped by the experimenter. This rate is slightly lower than the percentage who continued beyond this point in Milgram’s comparable condition (82.5%), although the difference fell short of statistical significance, 2 (1, N 80) 1.10, p .29.1 Contrary to expectation, the percentage of participants in the modeled refusal condition who continued past the 150-volt point (63.3%) also was not significantly different from the percentage who did so in the base condition, 2 (1, N 70) 0.11, p .74. I also looked at when in the procedure the participant received the first prod from the experimenter. This was the point at which the participant first expressed concern about continuing the procedure. Participants were assigned a value from 1 to 12 depending on the last switch they pressed before receiving a prod, with 1 pressed no switches, 2 after pressing the 15-volt switch, and so forth. Participants who received no prods were assigned a value of 12. I compared the two conditions on this measure. Participants in the base condition (M 7.65) received a prod from the experimenter significantly earlier than participants in the modeled refusal condition (M 9.56), t(68) 2.75, p .008, d .64. However, it should be noted that participants in the modeled refusal condition did not have an opportunity to express reluctance until after the 90-volt switch was pressed (a score of 7 on the 12-point scale). Not surprisingly, participants who refused to continue (M 6.52) had lower first-prod scores than those who continued until stopped by the experimenter (M 9.43), t(68) 4.20, p .001, d .96. As shown in Table 3, there was little difference in obedience rates between men and women. Although women were slightly more likely than men to continue in both the base condition and the modeled refusal condition, the differences were not significant in either condition, 2 (1, N 40) 0.01, p .95 and 2 (1, N 30) 1.35, p .74, respectively, or when the conditions were combined, 2 (1, N 70) 0.25, p .62. In addition, the first-prod score for the men (M 8.34) was not signifi- cantly different from the first-prod score for the women (M 8.56), t(68) 0.29, p .77. I also was interested in the relation between participants’ rates of obedience and scores on two personality trait measures—empathic concern and desire for control.2 Three participants in the base condition did not complete the personality test items on either test (they failed to notice items on the back side of the test) and thus could not be used in these analyses. I compared the personality scores of those who continued with the procedure with the scores of those who stopped. As shown in Table 4, no significant 1 The failure to find a significant difference cannot be easily attributed to a lack of power. The sample size of 80 is within the ballpark for Cohen’s (1992) recommendation for finding a medium-sized effect and is much larger than the suggested number for a large effect. 2 Because the entire Interpersonal Reactivity Scale was administered, scores for the three other subscales were also obtained: Perspective Taking (the tendency to adopt another person’s point of view), Personal Distress (the tendency to be uncomfortable seeing others in stress), and Fantasy (the tendency to put oneself in imaginary situations). I compared the subscale scores between those who stopped and those who did not, and I looked at the correlation between the subscale scores and the first-prod scores. I had no theoretical reason to expect that significant effects would emerge in any of these analyses, and indeed they did not. Table 2 Numbers (and Percentages) of Participants Who Stopped and Who Continued Behavior Base condition Modeled refusal condition Milgram’s Experiment 5 Stopped at 150 volts or earlier 12 (30.0) 11 (36.7) 7 (17.5) Continued after 150 volts 28 (70.0) 19 (63.3) 33 (82.5) Table 3 Numbers (and Percentages) of Participants Who Stopped and Who Continued, by Gender Condition and behavior Men Women Base condition Stopped at 150 volts or earlier 6 (33.3) 6 (27.3) Continued after 150 volts 12 (66.7) 16 (72.7) Modeled refusal condition Stopped at 150 volts or earlier 5 (45.5) 6 (31.6) Continued after 150 volts 6 (54.5) 13 (68.4) 8 January 2009 ● American Psychologist�����