正在加载图片...
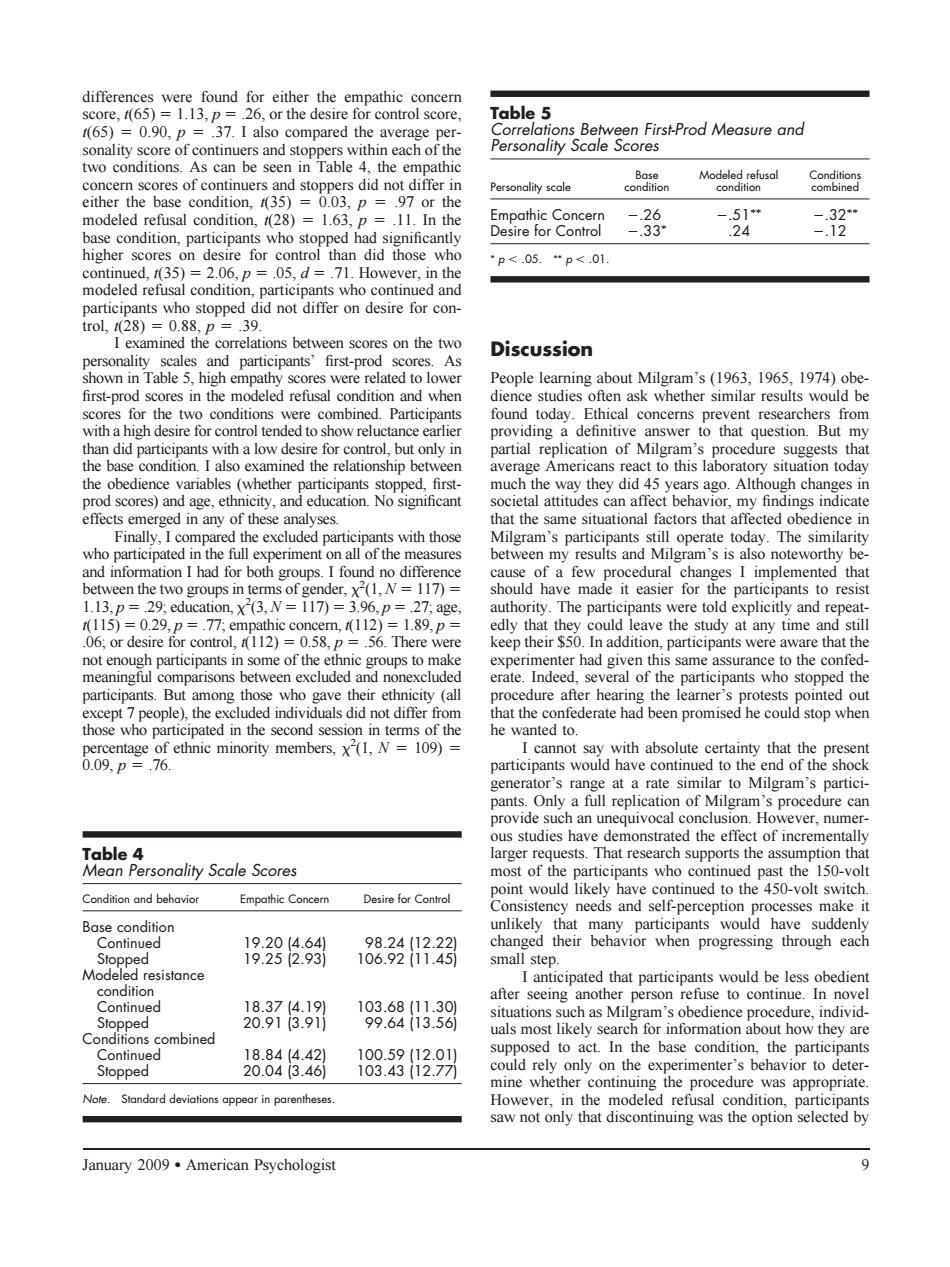
Table 5 oalacoeofenetmeeadnaepeeDcnhneachorthe rod Measureand Concern scores of continuers asd stooloss ad no differ in Modeled 28)=1.63 二3 4 .206, 05.d How ·p<.05."p<01. in the macdesmA examin the correlations bet Discussion People learning about Milgram's(1963.1965,1974)obe nrst-pro whe di swer to that question.But effects emerged in any of these analyses that the same sitational factors that afrected Finally. oups.I found no differ of a few procedural changes I implemented that 1=0 N pa 、l 029P= 1.89 ave the study at any time and no some of the eth ps to enter had gi n this sam eassurance to the confed wenekclucedandnOe erate.Inde ral of the participants who stopped th people).the e luded indivi the sec ond sessi he wanted to ith absolut 0.09.D6 gene to Milgram's partc h an unequivocal conclusi r.nun most of the ued past the15-vo Desire for Control needs and self-perception ocesses make i Base condition unlikely 182829 18322 small step. after s 28377 198,88B38 situations procedure. posed to act In the base condition the parti 884189,83》 theermenter's behavior to et However. January 2009.American Psychologist differences were found for either the empathic concern score, t(65) 1.13, p .26, or the desire for control score, t(65) 0.90, p .37. I also compared the average personality score of continuers and stoppers within each of the two conditions. As can be seen in Table 4, the empathic concern scores of continuers and stoppers did not differ in either the base condition, t(35) 0.03, p .97 or the modeled refusal condition, t(28) 1.63, p .11. In the base condition, participants who stopped had significantly higher scores on desire for control than did those who continued, t(35) 2.06, p .05, d .71. However, in the modeled refusal condition, participants who continued and participants who stopped did not differ on desire for control, t(28) 0.88, p .39. I examined the correlations between scores on the two personality scales and participants’ first-prod scores. As shown in Table 5, high empathy scores were related to lower first-prod scores in the modeled refusal condition and when scores for the two conditions were combined. Participants with a high desire for control tended to show reluctance earlier than did participants with a low desire for control, but only in the base condition. I also examined the relationship between the obedience variables (whether participants stopped, firstprod scores) and age, ethnicity, and education. No significant effects emerged in any of these analyses. Finally, I compared the excluded participants with those who participated in the full experiment on all of the measures and information I had for both groups. I found no difference between the two groups in terms of gender, 2 (1, N 117) 1.13, p .29; education, 2 (3, N 117) 3.96, p .27; age, t(115) 0.29, p .77; empathic concern, t(112) 1.89, p .06; or desire for control, t(112) 0.58, p .56. There were not enough participants in some of the ethnic groups to make meaningful comparisons between excluded and nonexcluded participants. But among those who gave their ethnicity (all except 7 people), the excluded individuals did not differ from those who participated in the second session in terms of the percentage of ethnic minority members, 2 (1, N 109) 0.09, p .76. Discussion People learning about Milgram’s (1963, 1965, 1974) obedience studies often ask whether similar results would be found today. Ethical concerns prevent researchers from providing a definitive answer to that question. But my partial replication of Milgram’s procedure suggests that average Americans react to this laboratory situation today much the way they did 45 years ago. Although changes in societal attitudes can affect behavior, my findings indicate that the same situational factors that affected obedience in Milgram’s participants still operate today. The similarity between my results and Milgram’s is also noteworthy because of a few procedural changes I implemented that should have made it easier for the participants to resist authority. The participants were told explicitly and repeatedly that they could leave the study at any time and still keep their $50. In addition, participants were aware that the experimenter had given this same assurance to the confederate. Indeed, several of the participants who stopped the procedure after hearing the learner’s protests pointed out that the confederate had been promised he could stop when he wanted to. I cannot say with absolute certainty that the present participants would have continued to the end of the shock generator’s range at a rate similar to Milgram’s participants. Only a full replication of Milgram’s procedure can provide such an unequivocal conclusion. However, numerous studies have demonstrated the effect of incrementally larger requests. That research supports the assumption that most of the participants who continued past the 150-volt point would likely have continued to the 450-volt switch. Consistency needs and self-perception processes make it unlikely that many participants would have suddenly changed their behavior when progressing through each small step. I anticipated that participants would be less obedient after seeing another person refuse to continue. In novel situations such as Milgram’s obedience procedure, individuals most likely search for information about how they are supposed to act. In the base condition, the participants could rely only on the experimenter’s behavior to determine whether continuing the procedure was appropriate. However, in the modeled refusal condition, participants saw not only that discontinuing was the option selected by Table 4 Mean Personality Scale Scores Condition and behavior Empathic Concern Desire for Control Base condition Continued 19.20 (4.64) 98.24 (12.22) Stopped 19.25 (2.93) 106.92 (11.45) Modeled resistance condition Continued 18.37 (4.19) 103.68 (11.30) Stopped 20.91 (3.91) 99.64 (13.56) Conditions combined Continued 18.84 (4.42) 100.59 (12.01) Stopped 20.04 (3.46) 103.43 (12.77) Note. Standard deviations appear in parentheses. Table 5 Correlations Between First-Prod Measure and Personality Scale Scores Personality scale Base condition Modeled refusal condition Conditions combined Empathic Concern .26 .51 .32 Desire for Control .33 .24 .12 p .05. p .01. January 2009 ● American Psychologist 9���