正在加载图片...
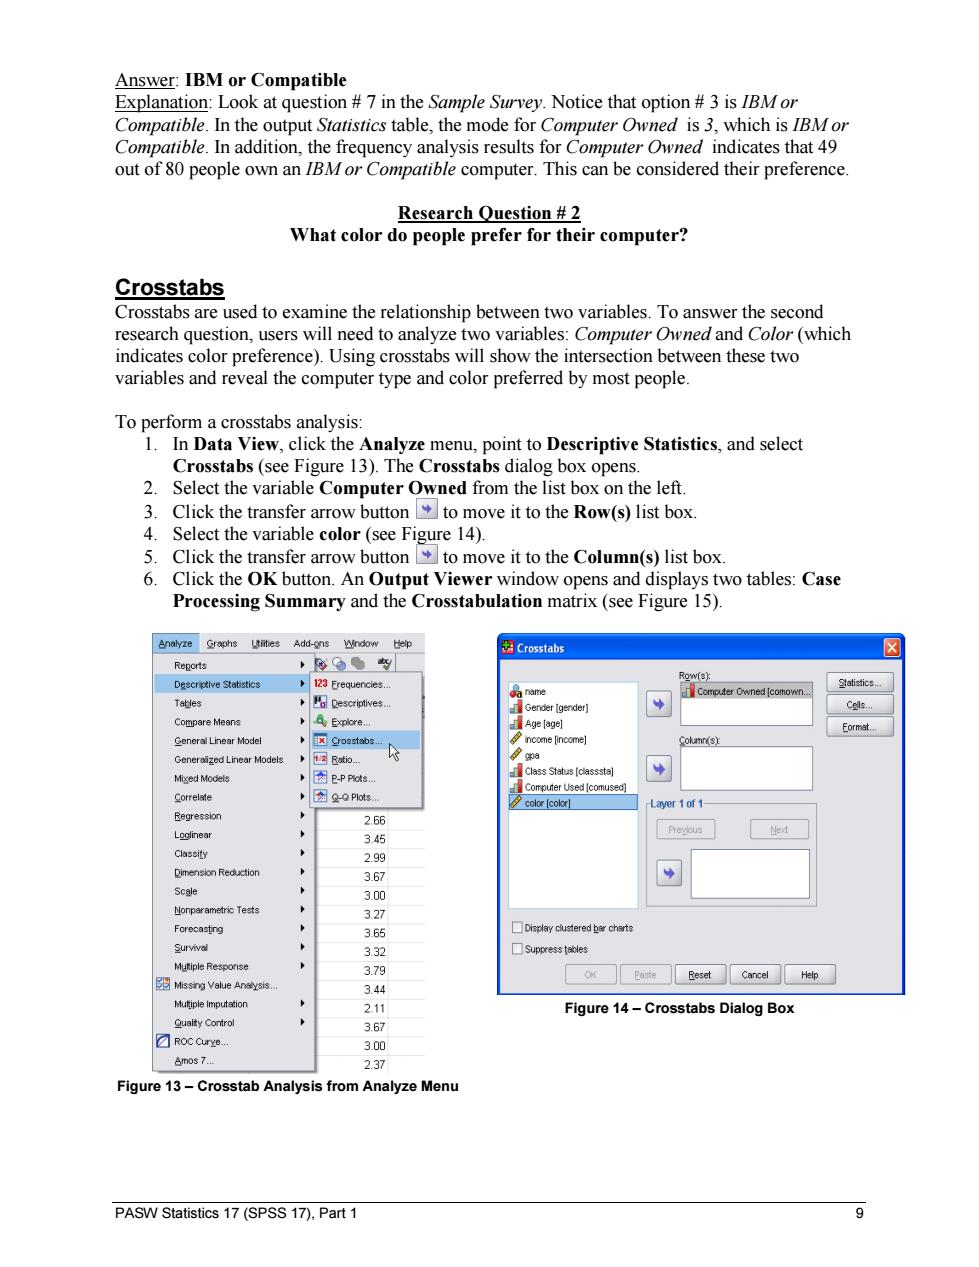
Answer:IBM or Compatible Explanation:Look at question 7 in the Sample Survey.Notice that option 3 is IBMor Compatible.In the output Statistics table,the mode for Computer Owned is 3,which is IBM or Compatible.In addition,the frequency analysis results for Computer Owned indicates that 49 out of 80 people own an IBM or Compatible computer.This can be considered their preference. Research Question 2 What color do people prefer for their computer? Crosstabs Crosstabs are used to examine the relationship between two variables.To answer the second research question,users will need to analyze two variables:Computer Owned and Color(which indicates color preference).Using crosstabs will show the intersection between these two variables and reveal the computer type and color preferred by most people. To perform a crosstabs analysis: 1.In Data View,click the Analyze menu,point to Descriptive Statistics,and select Crosstabs(see Figure 13).The Crosstabs dialog box opens. 2.Select the variable Computer Owned from the list box on the left. 3.Click the transfer arrow button to move it to the Row(s)list box 4. Select the variable color (see Figure 14). 5.Click the transfer arrow button to move it to the Column(s)list box. 6. Click the OK button.An Output Viewer window opens and displays two tables:Case Processing Summary and the Crosstabulation matrix(see Figure 15). Bnalyze Graphs Utiities Add-ons Wndow Help 图Crosstabs ☒ Reports +色●应 Row(s): Descriptive Statistics 123 Erequencies. Statistics. da name Computer Owned [comown. Tables Descriptives.. Gender [gender] Cels. Compare Means Explore... Age [age] Eormat... General Linear Model 目3gro8 stabs. 号income [income] Column(s) Generaized Linear Models Ratio... Miged Models →图B-PPkots. Class Status [classsta] Computer Used [comused] Correlate 因Q-Plots. color [color] -Layer 1 of 1- Regression 2.66 Loglinear 3.45 Classify 2.99 Dimension Reduction 3.67 Scale 3.00 Nonparametric Tests 3.27 Forecasting 3.65 Display clustered ber charts Survival 3.32 ☐Suppress tebles Mutiple Response 3.79 Reset Cancel Help 3 Misng Value Aneysis.… 3.44 Mutiple Imputation 2.11 Figure 14-Crosstabs Dialog Box Qualty Control 3.67 ☑ROC Curye. 3.00 色mos7. 2.37 Figure 13-Crosstab Analysis from Analyze Menu PASW Statistics 17(SPSS 17).Part 1 9PASW Statistics 17 (SPSS 17), Part 1 9 Answer: IBM or Compatible Explanation: Look at question # 7 in the Sample Survey. Notice that option # 3 is IBM or Compatible. In the output Statistics table, the mode for Computer Owned is 3, which is IBM or Compatible. In addition, the frequency analysis results for Computer Owned indicates that 49 out of 80 people own an IBM or Compatible computer. This can be considered their preference. Research Question # 2 What color do people prefer for their computer? Crosstabs Crosstabs are used to examine the relationship between two variables. To answer the second research question, users will need to analyze two variables: Computer Owned and Color (which indicates color preference). Using crosstabs will show the intersection between these two variables and reveal the computer type and color preferred by most people. To perform a crosstabs analysis: 1. In Data View, click the Analyze menu, point to Descriptive Statistics, and select Crosstabs (see Figure 13). The Crosstabs dialog box opens. 2. Select the variable Computer Owned from the list box on the left. 3. Click the transfer arrow button to move it to the Row(s) list box. 4. Select the variable color (see Figure 14). 5. Click the transfer arrow button to move it to the Column(s) list box. 6. Click the OK button. An Output Viewer window opens and displays two tables: Case Processing Summary and the Crosstabulation matrix (see Figure 15). Figure 13 – Crosstab Analysis from Analyze Menu Figure 14 – Crosstabs Dialog Box