正在加载图片...
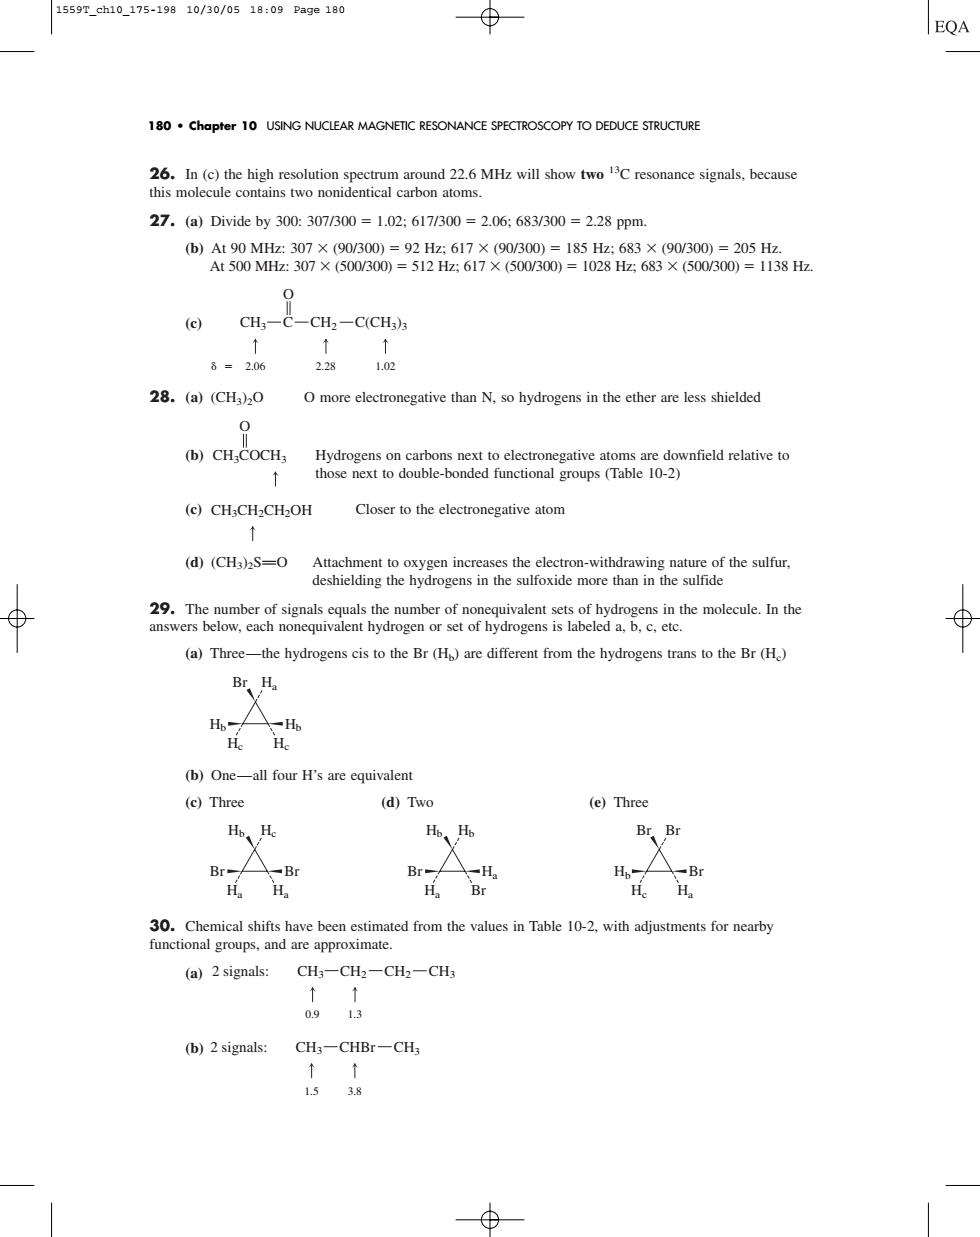
1559T_ch10_175-19810/30/0518:09Pa9e180 ⊕ EQA 180 Chapter 10 USING NUCLEAR MAGNETIC RESONANCE SPECTROSCOPY TO DEDUCE STRUCTURE 27.(a)Divide by300:307/300=1.02:617/300=2.06:683/300=2.28ppm CH3-C-CH2-C(CH3)3 8=206 228 102 28.(a)(CH)20 O more electronegative than N.so hydrogens in the ether are less shielded (b)CHaCOCH Hydrogens on carbons next to electronegative atoms are downfield relative to those next to double-bonded functional groups (Table 10-2) Closer to the electronegative atom (d)(CHa)2S-O Attach (a)Three-the hydrogens cis to the Br (H)are different from the hydrogens trans to the Br(H) Br Ha (b)One-all four H's are equivalent (c)Three (d)Two (e)Three BrBr 30.Chemical shifts have been estimated from the values in Table 10-2.with adjustments for nearby functional groups,and are approximate. (a)2 signals:CH3-CH2-CH2-CHs 0913 (b)2signals: CH,-CHBr-CH3 1.5 26. In (c) the high resolution spectrum around 22.6 MHz will show two 13C resonance signals, because this molecule contains two nonidentical carbon atoms. 27. (a) Divide by 300: 307/300 1.02; 617/300 2.06; 683/300 2.28 ppm. (b) At 90 MHz: 307
(90/300) 92 Hz; 617
(90/300) 185 Hz; 683
(90/300) 205 Hz. At 500 MHz: 307
(500/300) 512 Hz; 617
(500/300) 1028 Hz; 683
(500/300) 1138 Hz. (c) 28. (a) (CH3)2O O more electronegative than N, so hydrogens in the ether are less shielded (b) Hydrogens on carbons next to electronegative atoms are downfield relative to those next to double-bonded functional groups (Table 10-2) (c) Closer to the electronegative atom (d) (CH3)2SPO Attachment to oxygen increases the electron-withdrawing nature of the sulfur, deshielding the hydrogens in the sulfoxide more than in the sulfide 29. The number of signals equals the number of nonequivalent sets of hydrogens in the molecule. In the answers below, each nonequivalent hydrogen or set of hydrogens is labeled a, b, c, etc. (a) Three—the hydrogens cis to the Br (Hb) are different from the hydrogens trans to the Br (Hc) (b) One—all four H’s are equivalent (c) Three (d) Two (e) Three 30. Chemical shifts have been estimated from the values in Table 10-2, with adjustments for nearby functional groups, and are approximate. (a) (b) 2 signals: CH3 CHBr CH3 1.5 3.8 2 signals: CH3 CH2 CH2 CH3 0.9 1.3 Hb Br Hc Ha Br Br Br Ha Ha Br Hb Hb Br Br Ha Ha Hb Hc Hb Hb Hc Hc Br Ha CH3CH2CH2OH O CH3COCH3 CH3 C CH2 C(CH3)3 O 2.06 2.28 1.02 180 • Chapter 10 USING NUCLEAR MAGNETIC RESONANCE SPECTROSCOPY TO DEDUCE STRUCTURE 1559T_ch10_175-198 10/30/05 18:09 Page 180�