正在加载图片...
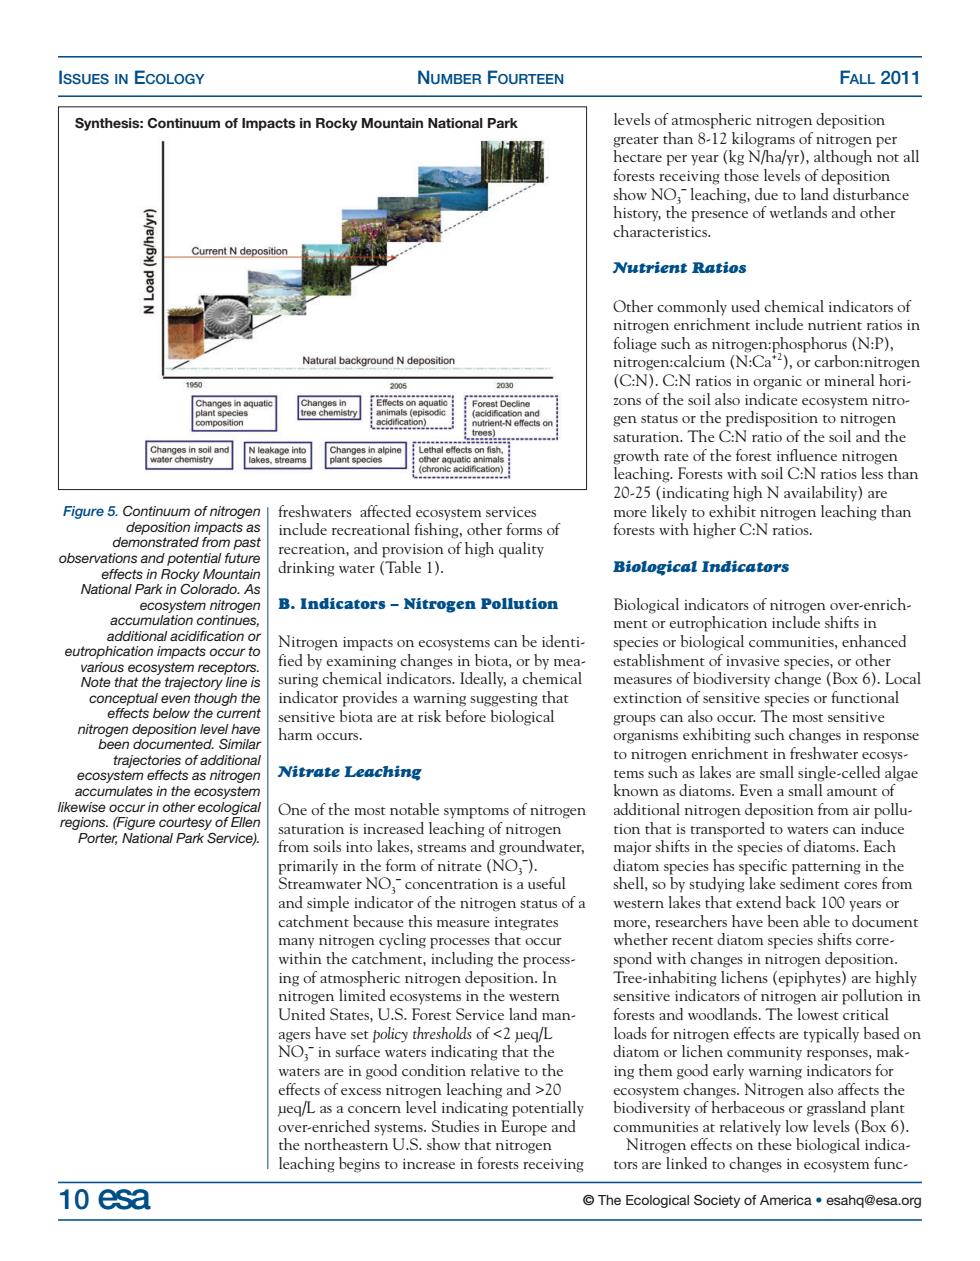
ISSUES IN ECOLOGY NUMBER FOURTEEN FALL 2011 Synthesis:Continuum of Impacts in Rocky Mountain National Park levels of atmospheric nitrogen deposition all n d her Nutrient Ratios kground N depe ons of the soil also indicate the Figure s af creation,and provision of high quality pote drinking water (Table 1). Biological Indicators National Park in Color B.Indicators -Nitrogen Pollution Biological indicators of ogen impacts on ecosystems can be identi ment of invasive specie sting that extinction of sensitive species or functional ne most sensitive narm occurs. stem effect Nitrate Leaching ems such as lakes are small single-celled algae Iamount e One of the most notabl ion that is t m air Po from soils into lakes,streams an ific pattering in the nd simpe indicator of the nitrogen starus of a western lakes that extend back 100 vears or catchment because this measure integrates t occur ent d s corre ing of atm ospheric nitroger sition In abiting liche ns(epiphytes)are highly sensitive indicators and woodl NO.waters indicating that the ing them good carly waming indica ors for g Nitrogen also affe munities at relatively low levels (Box 6). nort Nitr on these biological indica eaching begins to increase in forests receiving 10 esa The Ecological Society of America esahq@esa.org ISSUES IN ECOLOGY NUMBER FOURTEEN FALL 2011 10 esa © The Ecological Society of America • esahq@esa.org freshwaters affected ecosystem services include recreational fishing, other forms of recreation, and provision of high quality drinking water (Table 1). B. Indicators – Nitrogen Pollution Nitrogen impacts on ecosystems can be identified by examining changes in biota, or by measuring chemical indicators. Ideally, a chemical indicator provides a warning suggesting that sensitive biota are at risk before biological harm occurs. Nitrate Leaching One of the most notable symptoms of nitrogen saturation is increased leaching of nitrogen from soils into lakes, streams and groundwater, primarily in the form of nitrate (NO3 – ). Streamwater NO3 – concentration is a useful and simple indicator of the nitrogen status of a catchment because this measure integrates many nitrogen cycling processes that occur within the catchment, including the processing of atmospheric nitrogen deposition. In nitrogen limited ecosystems in the western United States, U.S. Forest Service land managers have set policy thresholds of <2 µeq/L NO3 – in surface waters indicating that the waters are in good condition relative to the effects of excess nitrogen leaching and >20 µeq/L as a concern level indicating potentially over-enriched systems. Studies in Europe and the northeastern U.S. show that nitrogen leaching begins to increase in forests receiving levels of atmospheric nitrogen deposition greater than 8-12 kilograms of nitrogen per hectare per year (kg N/ha/yr), although not all forests receiving those levels of deposition show NO3 – leaching, due to land disturbance history, the presence of wetlands and other characteristics. Nutrient Ratios Other commonly used chemical indicators of nitrogen enrichment include nutrient ratios in foliage such as nitrogen:phosphorus (N:P), nitrogen:calcium (N:Ca+2), or carbon:nitrogen (C:N). C:N ratios in organic or mineral horizons of the soil also indicate ecosystem nitrogen status or the predisposition to nitrogen saturation. The C:N ratio of the soil and the growth rate of the forest influence nitrogen leaching. Forests with soil C:N ratios less than 20-25 (indicating high N availability) are more likely to exhibit nitrogen leaching than forests with higher C:N ratios. Biological Indicators Biological indicators of nitrogen over-enrichment or eutrophication include shifts in species or biological communities, enhanced establishment of invasive species, or other measures of biodiversity change (Box 6). Local extinction of sensitive species or functional groups can also occur. The most sensitive organisms exhibiting such changes in response to nitrogen enrichment in freshwater ecosystems such as lakes are small single-celled algae known as diatoms. Even a small amount of additional nitrogen deposition from air pollution that is transported to waters can induce major shifts in the species of diatoms. Each diatom species has specific patterning in the shell, so by studying lake sediment cores from western lakes that extend back 100 years or more, researchers have been able to document whether recent diatom species shifts correspond with changes in nitrogen deposition. Tree-inhabiting lichens (epiphytes) are highly sensitive indicators of nitrogen air pollution in forests and woodlands. The lowest critical loads for nitrogen effects are typically based on diatom or lichen community responses, making them good early warning indicators for ecosystem changes. Nitrogen also affects the biodiversity of herbaceous or grassland plant communities at relatively low levels (Box 6). Nitrogen effects on these biological indicators are linked to changes in ecosystem funcFigure 5. Continuum of nitrogen deposition impacts as demonstrated from past observations and potential future effects in Rocky Mountain National Park in Colorado. As ecosystem nitrogen accumulation continues, additional acidification or eutrophication impacts occur to various ecosystem receptors. Note that the trajectory line is conceptual even though the effects below the current nitrogen deposition level have been documented. Similar trajectories of additional ecosystem effects as nitrogen accumulates in the ecosystem likewise occur in other ecological regions. (Figure courtesy of Ellen Porter, National Park Service). Synthesis: Continuum of Impacts in Rocky Mountain National Park