正在加载图片...
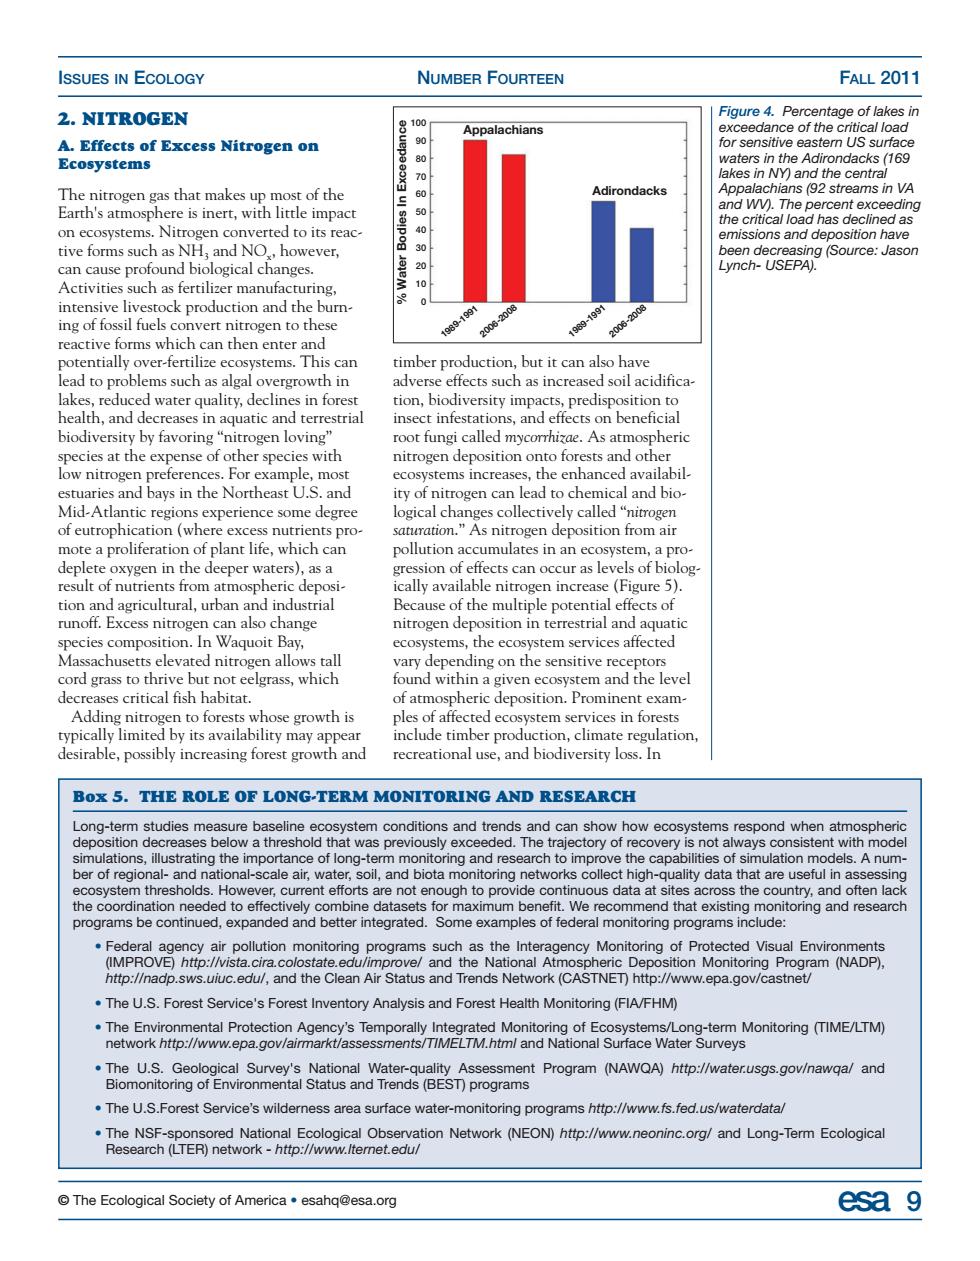
ISSUES IN ECOLOGY NUMBER FOURTEEN FALL 2011 2.NITROGEN chians A.Nitrogen on acks (168 The nitr s that mako of the rondack Earth's amophere.with litte impact d WV).The nand de tivef Activities such as fertilizer manufacturing. the reactive forms which can the and biodiversity by favoring"itrogen loving root fungi called mycomhizae.As atmospheric aries and bays in the Northeast U.S.and ir of nitrogen an lead to chemical and bio- Mid-Atlantic regions experience some degree of cu deplete oxygen in the deeper waters),as a sion of effects can occur as levels of biolo ole nitrogen increase (Figure 5). urt the mu tiple poten cts ecosystems,the ecosvstem services affected ples of affected ecosystem services in forests bly ncreasing forest grov Box 5.THE ROLE OF LONG-TERM MONITORING AND RESEARCH Long-term studies measure baseline e and can show hov espond when a epositiond stem conditions and trends thre nrae tory o ot tent wit ode and res he onak onal oring networks colle ah to and often ac Monito ve/and onal nd th an A The U.S.Forest Service's Forest Inventory Analysis and Forest Health Monitoring(FIA/FHM) rveys The U.S.Forest Service's wilderness area surface water-monitoring programs http://www.fs.fed.us/waterdata 'PeeNee2E2neakenmp5CeceOeelionNetwokNEoNhpwwnwnoonc.og/andLong-1emEcologca The Ecological Society of America.esahg@esa.ord esa 9© The Ecological Society of America • esahq@esa.org esa 9 ISSUES IN ECOLOGY NUMBER FOURTEEN FALL 2011 2. NITROGEN A. Effects of Excess Nitrogen on Ecosystems The nitrogen gas that makes up most of the Earth's atmosphere is inert, with little impact on ecosystems. Nitrogen converted to its reactive forms such as NH3 and NOx, however, can cause profound biological changes. Activities such as fertilizer manufacturing, intensive livestock production and the burning of fossil fuels convert nitrogen to these reactive forms which can then enter and potentially over-fertilize ecosystems. This can lead to problems such as algal overgrowth in lakes, reduced water quality, declines in forest health, and decreases in aquatic and terrestrial biodiversity by favoring “nitrogen loving” species at the expense of other species with low nitrogen preferences. For example, most estuaries and bays in the Northeast U.S. and Mid-Atlantic regions experience some degree of eutrophication (where excess nutrients promote a proliferation of plant life, which can deplete oxygen in the deeper waters), as a result of nutrients from atmospheric deposition and agricultural, urban and industrial runoff. Excess nitrogen can also change species composition. In Waquoit Bay, Massachusetts elevated nitrogen allows tall cord grass to thrive but not eelgrass, which decreases critical fish habitat. Adding nitrogen to forests whose growth is typically limited by its availability may appear desirable, possibly increasing forest growth and timber production, but it can also have adverse effects such as increased soil acidification, biodiversity impacts, predisposition to insect infestations, and effects on beneficial root fungi called mycorrhizae. As atmospheric nitrogen deposition onto forests and other ecosystems increases, the enhanced availability of nitrogen can lead to chemical and biological changes collectively called “nitrogen saturation.” As nitrogen deposition from air pollution accumulates in an ecosystem, a progression of effects can occur as levels of biologically available nitrogen increase (Figure 5). Because of the multiple potential effects of nitrogen deposition in terrestrial and aquatic ecosystems, the ecosystem services affected vary depending on the sensitive receptors found within a given ecosystem and the level of atmospheric deposition. Prominent examples of affected ecosystem services in forests include timber production, climate regulation, recreational use, and biodiversity loss. In Figure 4. Percentage of lakes in exceedance of the critical load for sensitive eastern US surface waters in the Adirondacks (169 lakes in NY) and the central Appalachians (92 streams in VA and WV). The percent exceeding the critical load has declined as emissions and deposition have been decreasing (Source: Jason Lynch- USEPA). Box 5. THE ROLE OF LONG-TERM MONITORING AND RESEARCH Long-term studies measure baseline ecosystem conditions and trends and can show how ecosystems respond when atmospheric deposition decreases below a threshold that was previously exceeded. The trajectory of recovery is not always consistent with model simulations, illustrating the importance of long-term monitoring and research to improve the capabilities of simulation models. A number of regional- and national-scale air, water, soil, and biota monitoring networks collect high-quality data that are useful in assessing ecosystem thresholds. However, current efforts are not enough to provide continuous data at sites across the country, and often lack the coordination needed to effectively combine datasets for maximum benefit. We recommend that existing monitoring and research programs be continued, expanded and better integrated. Some examples of federal monitoring programs include: • Federal agency air pollution monitoring programs such as the Interagency Monitoring of Protected Visual Environments (IMPROVE) http://vista.cira.colostate.edu/improve/ and the National Atmospheric Deposition Monitoring Program (NADP), http://nadp.sws.uiuc.edu/, and the Clean Air Status and Trends Network (CASTNET) http://www.epa.gov/castnet/ • The U.S. Forest Service's Forest Inventory Analysis and Forest Health Monitoring (FIA/FHM) • The Environmental Protection Agency’s Temporally Integrated Monitoring of Ecosystems/Long-term Monitoring (TIME/LTM) network http://www.epa.gov/airmarkt/assessments/TIMELTM.html and National Surface Water Surveys • The U.S. Geological Survey's National Water-quality Assessment Program (NAWQA) http://water.usgs.gov/nawqa/ and Biomonitoring of Environmental Status and Trends (BEST) programs • The U.S.Forest Service’s wilderness area surface water-monitoring programs http://www.fs.fed.us/waterdata/ • The NSF-sponsored National Ecological Observation Network (NEON) http://www.neoninc.org/ and Long-Term Ecological Research (LTER) network - http://www.lternet.edu/ Appalachians Adirondacks % Water Bodies In Exceedance 1989-1991 2006-2008 1989-1991 2006-2008 100 90 80 70 60 50 40 30 20 10 0