正在加载图片...

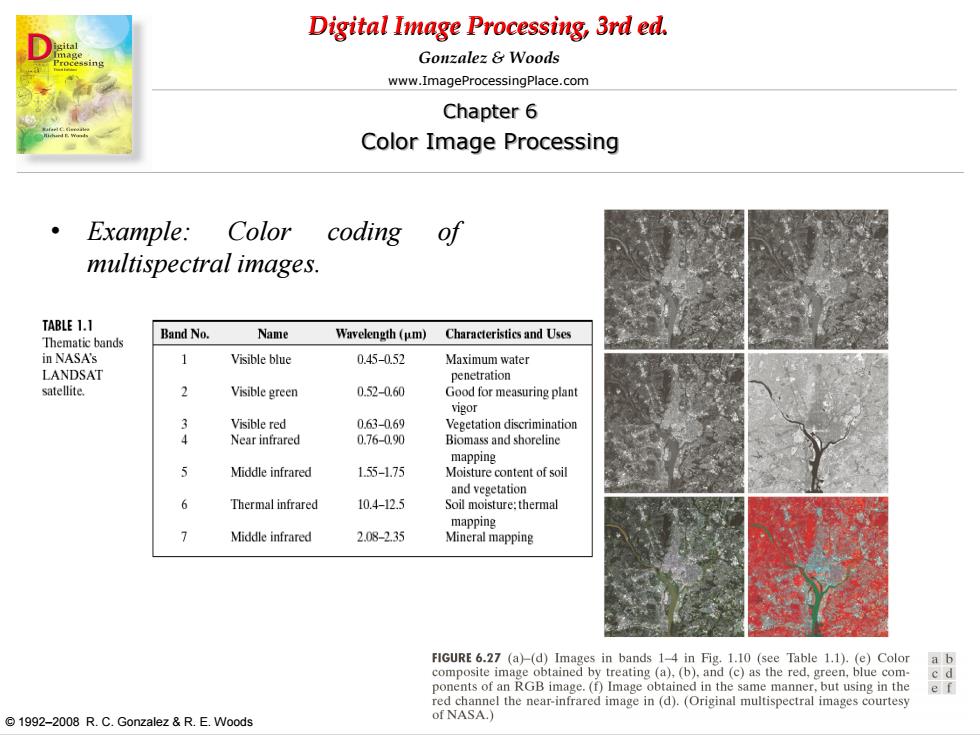
Digital Image Processing,3rd ed. Gonzalez Woods www.ImageProcessingPlace.com Chapter 6 Color Image Processing Example: Color coding of multispectral images. TABLE 1.1 Band No. Name Thematic bands Wavelength(um)Characteristics and Uses in NASA's 1 Visible blue 0.45-0.52 Maximum water LANDSAT penetration satellite. 2 Visible green 0.52-0.60 Good for measuring plant vigor 2 Visible red 0.63-0.69 Vegetation discrimination Near infrared 0.76-0.90 Biomass and shoreline mapping Middle infrared 155-1.75 Moisture content of soil and vegetation 6 Thermal infrared 10.4-12.5 Soil moisture:thermal mapping 7 Middle infrared 2.08-2.35 Mineral mapping FIGURE 6.27 (a)-(d)Images in bands 1-4 in Fig.1.10 (see Table 1.1).(e)Color a b composite image obtained by treating (a),(b).and (c)as the red,green,blue com- ponents of an RGB image.(f)Image obtained in the same manner,but using in the red channel the near-infrared image in (d).(Original multispectral images courtesy 1992-2008 R.C.Gonzalez &R.E.Woods of NASA.) Digital Image Processing, 3rd ed. www.ImageProcessingPlace.com © 1992–2008 R. C. Gonzalez & R. E. Woods Gonzalez & Woods Chapter 6 Color Image Processing • Example: Color coding of multispectral images