正在加载图片...
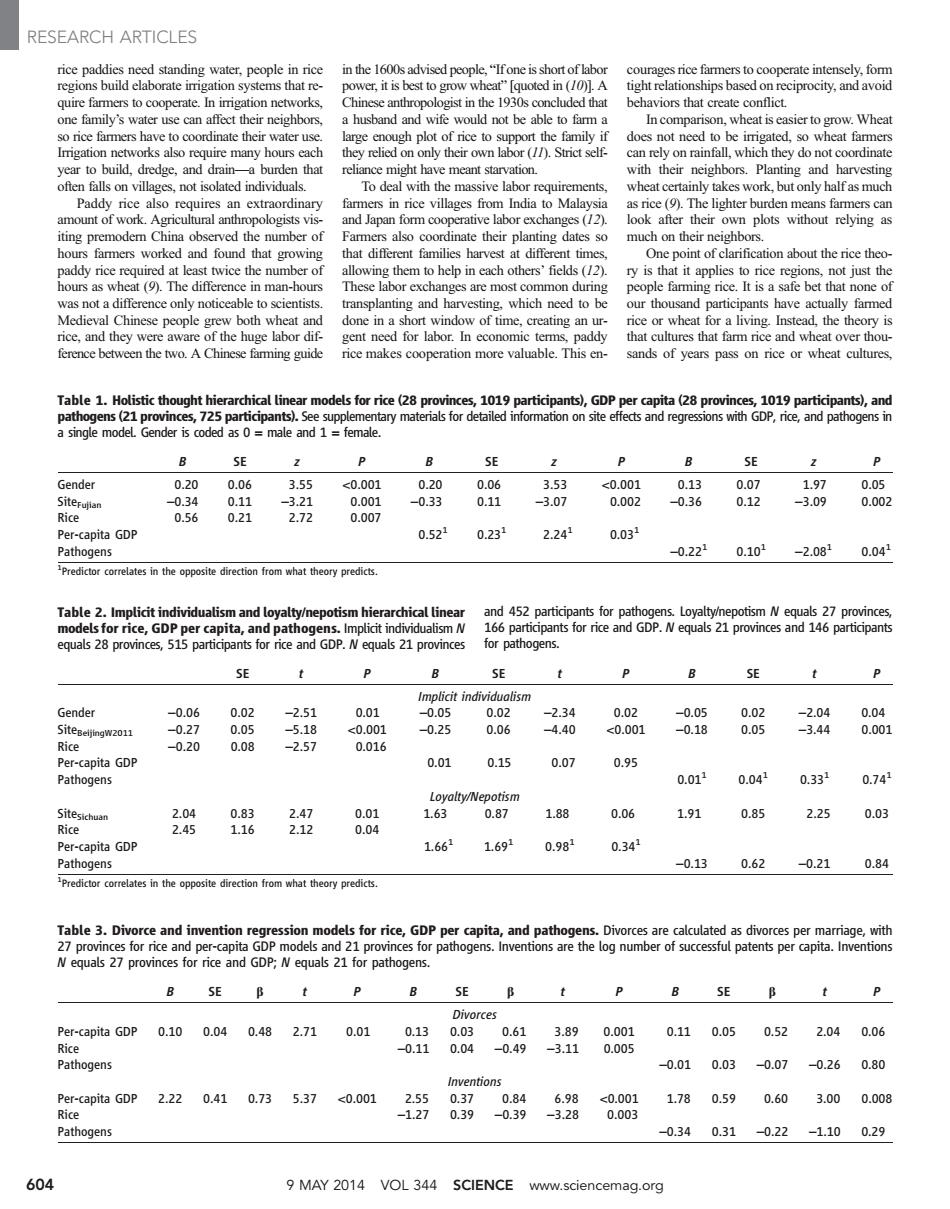
RESEARCH ARTICLES rice paddies need standing water.people in rice in the 1600s advised people,"Ifone is short of labor courages rice farmers to cooperate intensely,form regions build elaborate irrigation systems that re- power,it is best to grow wheat"[quoted in (/0).A tight relationships based on reciprocity,and avoid quire farmers to cooperate.In irigation networks. Chinese anthropologist in the 1930s concluded that behaviors that create conflict. one family's water use can affect their neighbors, a husband and wife would not be able to farm a In comparison,wheat is easier to grow.Wheat so rice farmers have to coordinate their water use. large enough plot of rice to support the family if does not need to be irrigated.so wheat farmers Irigation networks also require many hours each they relied on only their own labor (/)Strict self- can rely on rainfall,which they do not coordinate year to build,dredge,and drain-a burden that reliance might have meant starvation. with their neighbors.Planting and harvesting often falls on villages,not isolated individuals. To deal with the massive labor requirements, wheat certainly takes work.but only halfas much Paddy rice also requires an extraordinary farmers in rice villages from India to Malaysia as rice(9).The lighter burden means farmers can amount of work.Agricultural anthropologists vis- and Japan form cooperative labor exchanges(12). look after their own plots without relying as iting premodem China observed the number of Farmers also coordinate their planting dates so much on their neighbors. hours farmers worked and found that growing that different families harvest at different times, One point of clarification about the rice theo- paddy rice required at least twice the number of allowing them to help in each others'fields(12). ry is that it applies to rice regions,not just the hours as wheat (9).The difference in man-hours These labor exchanges are most common during people farming rice.It is a safe bet that none of was not a difference only noticeable to scientists. transplanting and harvesting,which need to be our thousand participants have actually farmed Medieval Chinese people grew both wheat and done in a short window of time,creating an ur- rice or wheat for a living.Instead,the theory is rice,and they were aware of the huge labor dif- gent need for labor.In economic terms,paddy that cultures that farm rice and wheat over thou- ference between the two.A Chinese farming guide rice makes cooperation more valuable.This en-sands of years pass on rice or wheat cultures. Table 1.Holistic thought hierarchical linear models for rice(28 provinces,1019 participants),GDP per capita(28 provinces,1019 participants),and pathogens(21 provinces,725 participants).See supplementary materials for detailed information on site effects and regressions with GDP,rice,and pathogens in a single model.Gender is coded as 0 male and 1 female. B SE 2 P B SE P B SE P Gender 0.20 0.06 3.55 <0.001 0.20 0.06 3.53 <0.001 0.13 0.07 1.97 0.05 Siterujian -0.34 0.11 -3.21 0.001 -0.33 0.11 -3.07 0.002 -0.36 0.12 -3.09 0.002 Rice 0.56 0.21 2.72 0.007 Per-capita GDP 0.521 0.231 2.241 0.032 Pathogens 0.22 0.102 -2.082 0.042 Predictor correlates in the opposite direction from what theory predicts Table 2.Implicit individualism and loyalty/nepotism hierarchical linear and 452 participants for pathogens.Loyalty/nepotism N equals 27 provinces models for rice,GDP per capita,and pathogens.Implicit individualism N 166 participants for rice and GDP.N equals 21 provinces and 146 participants equals 28 provinces,515 participants for rice and GDP.N equals 21 provinces for pathogens. SE t P SE B SE P Implicit individualism Gender -0.06 0.02 -2.51 0.01 -0.05 0.02 -2.34 0.02 -0.05 0.02 -2.04 0.04 Siteseljingw2011 -0.27 0.05 -5.18 <0.001 -0.25 0.06 -4.40 <0.001 -0.18 0.05 -3.44 0.001 Rice 0.20 0.08 -2.57 0.016 Per-capita GDP 0.01 0.15 0.07 0.95 Pathogens 0.011 0.042 0.331 0.741 Loyalty/Nepotism Sitesichuan 2.04 0.83 2.47 0.01 1.63 0.87 1.88 0.06 1.91 0.85 2.25 0.03 Rice 2.45 1.16 2.12 0.04 Per-capita GDP 1.661 1.691 0.982 0.341 Pathogens -0.13 0.62 -0.21 0.84 Predictor correlates in the opposite direction from what theory predicts Table 3.Divorce and invention regression models for rice,GDP per capita,and pathogens.Divorces are calculated as divorces per marriage,with 27 provinces for rice and per-capita GDP models and 21 provinces for pathogens.Inventions are the log number of successful patents per capita.Inventions N equals 27 provinces for rice and GDP;N equals 21 for pathogens. B SE B t P B SE SE P Divorces Per-capita GDP 0.10 0.040.482.71 0.01 0.13 0.03 0.61 3.89 0.001 0.11 0.05 0.52 2.04 0.06 Rice -0.11 0.04 -0.49 -3.11 0.005 Pathogens -0.01 0.03 -0.07 -0.26 0.80 Inventions Per-capita GDP 2.220.410.735.37 <0.001 2.55 0.370.84 6.98 <0.001 1.78 0.59 0.60 3.00 0.008 Rice -1.27 0.39 -0.39 -3.28 0.003 Pathogens 0.34 0.31 -0.22 -1.10 0.29 604 9 MAY 2014 VOL 344 SCIENCE www.sciencemag.orgrice paddies need standing water, people in rice regions build elaborate irrigation systems that require farmers to cooperate. In irrigation networks, one family’s water use can affect their neighbors, so rice farmers have to coordinate their water use. Irrigation networks also require many hours each year to build, dredge, and drain—a burden that often falls on villages, not isolated individuals. Paddy rice also requires an extraordinary amount of work. Agricultural anthropologists visiting premodern China observed the number of hours farmers worked and found that growing paddy rice required at least twice the number of hours as wheat (9). The difference in man-hours was not a difference only noticeable to scientists. Medieval Chinese people grew both wheat and rice, and they were aware of the huge labor difference between the two. A Chinese farming guide in the 1600s advised people, “If one is short of labor power, it is best to grow wheat” [quoted in (10)]. A Chinese anthropologist in the 1930s concluded that a husband and wife would not be able to farm a large enough plot of rice to support the family if they relied on only their own labor (11). Strict selfreliance might have meant starvation. To deal with the massive labor requirements, farmers in rice villages from India to Malaysia and Japan form cooperative labor exchanges (12). Farmers also coordinate their planting dates so that different families harvest at different times, allowing them to help in each others’ fields (12). These labor exchanges are most common during transplanting and harvesting, which need to be done in a short window of time, creating an urgent need for labor. In economic terms, paddy rice makes cooperation more valuable. This encourages rice farmers to cooperate intensely, form tight relationships based on reciprocity, and avoid behaviors that create conflict. In comparison, wheat is easier to grow. Wheat does not need to be irrigated, so wheat farmers can rely on rainfall, which they do not coordinate with their neighbors. Planting and harvesting wheat certainly takes work, but only half as much as rice (9). The lighter burden means farmers can look after their own plots without relying as much on their neighbors. One point of clarification about the rice theory is that it applies to rice regions, not just the people farming rice. It is a safe bet that none of our thousand participants have actually farmed rice or wheat for a living. Instead, the theory is that cultures that farm rice and wheat over thousands of years pass on rice or wheat cultures, Table 1. Holistic thought hierarchical linear models for rice (28 provinces, 1019 participants), GDP per capita (28 provinces, 1019 participants), and pathogens (21 provinces, 725 participants). See supplementary materials for detailed information on site effects and regressions with GDP, rice, and pathogens in a single model. Gender is coded as 0 = male and 1 = female. B SE zP B SE zPB SE z P Gender 0.20 0.06 3.55 <0.001 0.20 0.06 3.53 <0.001 0.13 0.07 1.97 0.05 SiteFujian –0.34 0.11 –3.21 0.001 –0.33 0.11 –3.07 0.002 –0.36 0.12 –3.09 0.002 Rice 0.56 0.21 2.72 0.007 Per-capita GDP 0.521 0.231 2.241 0.031 Pathogens –0.221 0.101 –2.081 0.041 1 Predictor correlates in the opposite direction from what theory predicts. Table 2. Implicit individualism and loyalty/nepotism hierarchical linear models for rice, GDP per capita, and pathogens. Implicit individualism N equals 28 provinces, 515 participants for rice and GDP. N equals 21 provinces and 452 participants for pathogens. Loyalty/nepotism N equals 27 provinces, 166 participants for rice and GDP. N equals 21 provinces and 146 participants for pathogens. SE tPB SE t PB SE t P Implicit individualism Gender –0.06 0.02 –2.51 0.01 –0.05 0.02 –2.34 0.02 –0.05 0.02 –2.04 0.04 SiteBeijingW2011 –0.27 0.05 –5.18 <0.001 –0.25 0.06 –4.40 <0.001 –0.18 0.05 –3.44 0.001 Rice –0.20 0.08 –2.57 0.016 Per-capita GDP 0.01 0.15 0.07 0.95 Pathogens 0.011 0.041 0.331 0.741 Loyalty/Nepotism SiteSichuan 2.04 0.83 2.47 0.01 1.63 0.87 1.88 0.06 1.91 0.85 2.25 0.03 Rice 2.45 1.16 2.12 0.04 Per-capita GDP 1.661 1.691 0.981 0.341 Pathogens –0.13 0.62 –0.21 0.84 1 Predictor correlates in the opposite direction from what theory predicts. Table 3. Divorce and invention regression models for rice, GDP per capita, and pathogens. Divorces are calculated as divorces per marriage, with 27 provinces for rice and per-capita GDP models and 21 provinces for pathogens. Inventions are the log number of successful patents per capita. Inventions N equals 27 provinces for rice and GDP; N equals 21 for pathogens. B SE b tP B SE b t PB SE b t P Divorces Per-capita GDP 0.10 0.04 0.48 2.71 0.01 0.13 0.03 0.61 3.89 0.001 0.11 0.05 0.52 2.04 0.06 Rice –0.11 0.04 –0.49 –3.11 0.005 Pathogens –0.01 0.03 –0.07 –0.26 0.80 Inventions Per-capita GDP 2.22 0.41 0.73 5.37 <0.001 2.55 0.37 0.84 6.98 <0.001 1.78 0.59 0.60 3.00 0.008 Rice –1.27 0.39 –0.39 –3.28 0.003 Pathogens –0.34 0.31 –0.22 –1.10 0.29 604 9 MAY 2014 VOL 344 SCIENCE www.sciencemag.org RESEARCH ARTICLES