正在加载图片...
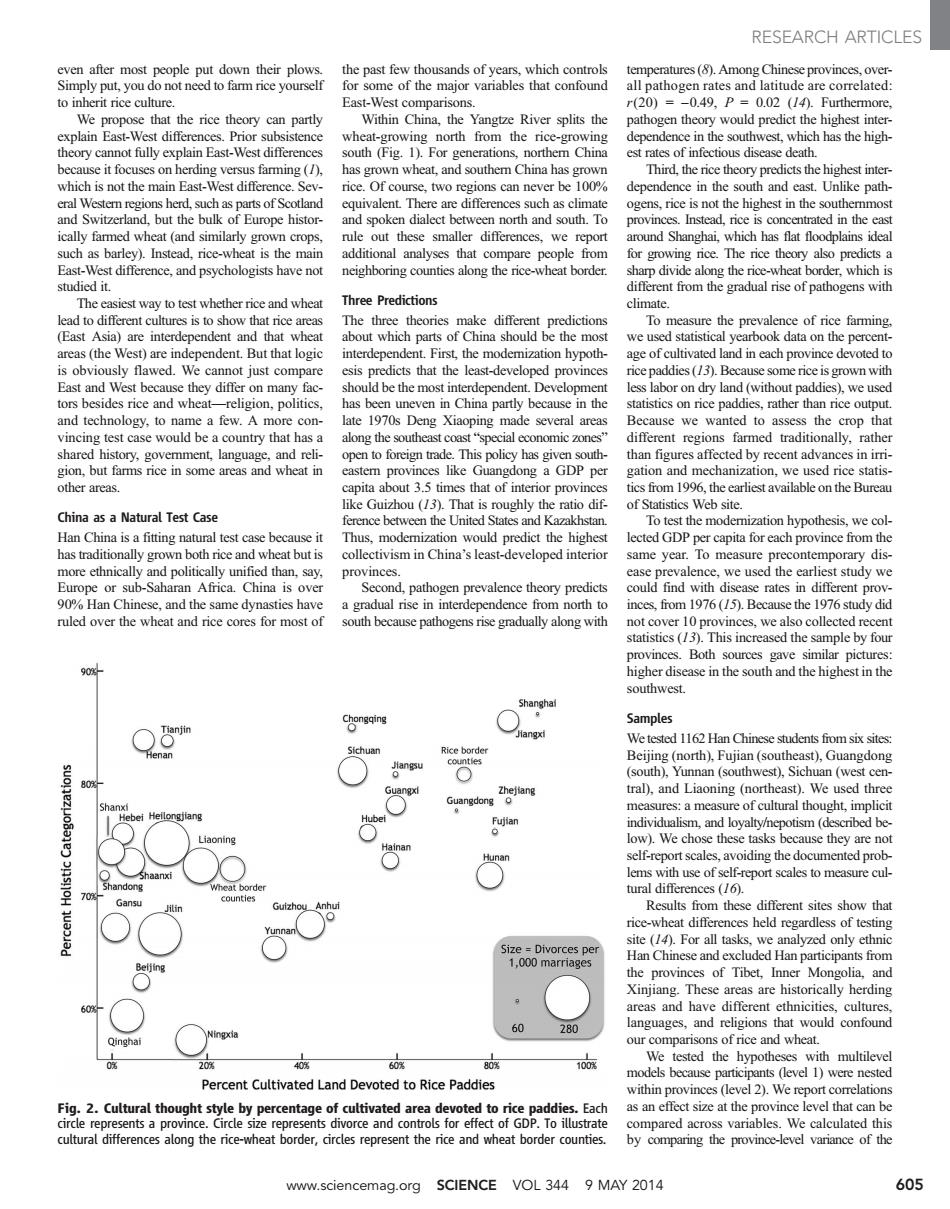
RESEARCH ARTICLES even after most people put down their plows. the past few thousands of years,which controls temperatures(8).Among Chinese provinces,over- Simply put,you do not need to farm rice yourself for some of the major variables that confound all pathogen rates and latitude are correlated: to inherit rice culture East-West comparisons. r(20)=-0.49,P=0.02(l40.Furthermore We propose that the rice theory can partly Within China,the Yangtze River splits the pathogen theory would predict the highest inter- explain East-West differences.Prior subsistence wheat-growing north from the rice-growing dependence in the southwest.which has the high- theory cannot fully explain East-West differences south (Fig.1).For generations,northem China est rates of infectious disease death. because it focuses on herding versus farming (/) has grown wheat,and southem China has grown Third,the rice theory predicts the highest inter- which is not the main East-West difference.Sev- rice.Of course,two regions can never be 100% dependence in the south and east.Unlike path- eral Westem regions herd,such as parts of Scotland equivalent.There are differences such as climate ogens,rice is not the highest in the southernmost and Switzerland,but the bulk of Europe histor- and spoken dialect between north and south.To provinces.Instead,rice is concentrated in the east ically farmed wheat(and similarly grown crops, rule out these smaller differences,we report around Shanghai.which has flat floodplains ideal such as barley).Instead,rice-wheat is the main additional analyses that compare people from for growing rice.The rice theory also predicts a East-West difference,and psychologists have not neighboring counties along the rice-wheat border. sharp divide along the rice-wheat border,which is studied it. different from the gradual rise of pathogens with The easiest way to test whether rice and wheat Three Predictions climate lead to different cultures is to show that rice areas The three theories make different predictions To measure the prevalence of rice farming. (East Asia)are interdependent and that wheat about which parts of China should be the most we used statistical yearbook data on the percent- areas (the West)are independent.But that logic interdependent.First,the modemization hypoth- age of cultivated land in each province devoted to is obviously flawed.We cannot just compare esis predicts that the least-developed provinces rice paddies (/3).Because some rice is grown with East and West because they differ on many fac- should be the most interdependent.Development less labor on dry land (without paddies).we used tors besides rice and wheat-religion,politics, has been uneven in China partly because in the statistics on rice paddies,rather than rice output. and technology,to name a few.A more con- late 1970s Deng Xiaoping made several areas Because we wanted to assess the crop that vincing test case would be a country that has a along the southeast coast "special economic zones" different regions farmed traditionally,rather shared history,goverment,language,and reli- open to foreign trade.This policy has given south- than figures affected by recent advances in irri- gion,but farms rice in some areas and wheat in eastem provinces like Guangdong a GDP per gation and mechanization,we used rice statis- other areas. capita about 3.5 times that of interior provinces tics from 1996,the earliest available on the Bureau like Guizhou (/3).That is roughly the ratio dif- of Statistics Web site. China as a Natural Test Case ference between the United States and Kazakhstan To test the modemization hypothesis,we col- Han China is a fitting natural test case because it Thus.modemization would predict the highest lected GDP per capita for each province from the has traditionally grown both rice and wheat but is collectivism in China's least-developed interior same year.To measure precontemporary dis- more ethnically and politically unified than,say, provinces. ease prevalence,we used the earliest study we Europe or sub-Saharan Africa.China is over Second,pathogen prevalence theory predicts could find with disease rates in different prov- 90%Han Chinese,and the same dynasties have a gradual rise in interdependence from north to inces,from 1976 (/5).Because the 1976 study did ruled over the wheat and rice cores for most of south because pathogens rise gradually along with not cover 10 provinces,we also collected recent statistics (/3).This increased the sample by four provinces.Both sources gave similar pictures: 90 higher disease in the south and the highest in the southwest. Shangha Samples Wetested 1162 Han Chinese students from six sites: Sichuan Rice border enan counties Beijing(north),Fujian(southeast),Guangdong ● (south).Yunnan (southwest).Sichuan (west cen- 80 Guangxl Zhejiang tral),and Liaoning (northeast).We used three Shanx Guangdong o measures:a measure of cultural thought,implicit Hebei Heilongjiang Fujian individualism,and loyalty/nepotism (described be- Liaoning low).We chose these tasks because they are not Hunar self-report scales,avoiding the documented prob- lems with use of self-report scales to measure cul- Shandong Wheat border tural differences (/6). 70 Gansu counties Results from these different sites show that rice-wheat differences held regardless of testing site (14).For all tasks,we analyzed only ethnic Size Divorces per 1,000 marriages Han Chinese and excluded Han participants from the provinces of Tibet,Inner Mongolia,and Xinjiang.These areas are historically herding 60 areas and have different ethnicities,cultures, languages,and religions that would confound Ningxia 60 280 Qinghai our comparisons of rice and wheat. 0 20 40 60% 809 100% We tested the hypotheses with multilevel models because participants (level 1)were nested Percent Cultivated Land Devoted to Rice Paddies within provinces (level 2).We report correlations Fig.2.Cultural thought style by percentage of cultivated area devoted to rice paddies.Each as an effect size at the province level that can be circle represents a province.Circle size represents divorce and controls for effect of GDP.To illustrate compared across variables.We calculated this cultural differences along the rice-wheat border,circles represent the rice and wheat border counties. by comparing the province-level variance of the www.sciencemag.org SCIENCE VOL 344 9 MAY 2014 605even after most people put down their plows. Simply put, you do not need to farm rice yourself to inherit rice culture. We propose that the rice theory can partly explain East-West differences. Prior subsistence theory cannot fully explain East-West differences because it focuses on herding versus farming (1), which is not the main East-West difference. Several Western regions herd, such as parts of Scotland and Switzerland, but the bulk of Europe historically farmed wheat (and similarly grown crops, such as barley). Instead, rice-wheat is the main East-West difference, and psychologists have not studied it. The easiest way to test whether rice and wheat lead to different cultures is to show that rice areas (East Asia) are interdependent and that wheat areas (the West) are independent. But that logic is obviously flawed. We cannot just compare East and West because they differ on many factors besides rice and wheat—religion, politics, and technology, to name a few. A more convincing test case would be a country that has a shared history, government, language, and religion, but farms rice in some areas and wheat in other areas. China as a Natural Test Case Han China is a fitting natural test case because it has traditionally grown both rice and wheat but is more ethnically and politically unified than, say, Europe or sub-Saharan Africa. China is over 90% Han Chinese, and the same dynasties have ruled over the wheat and rice cores for most of the past few thousands of years, which controls for some of the major variables that confound East-West comparisons. Within China, the Yangtze River splits the wheat-growing north from the rice-growing south (Fig. 1). For generations, northern China has grown wheat, and southern China has grown rice. Of course, two regions can never be 100% equivalent. There are differences such as climate and spoken dialect between north and south. To rule out these smaller differences, we report additional analyses that compare people from neighboring counties along the rice-wheat border. Three Predictions The three theories make different predictions about which parts of China should be the most interdependent. First, the modernization hypothesis predicts that the least-developed provinces should be the most interdependent. Development has been uneven in China partly because in the late 1970s Deng Xiaoping made several areas along the southeast coast “special economic zones” open to foreign trade. This policy has given southeastern provinces like Guangdong a GDP per capita about 3.5 times that of interior provinces like Guizhou (13). That is roughly the ratio difference between the United States and Kazakhstan. Thus, modernization would predict the highest collectivism in China’s least-developed interior provinces. Second, pathogen prevalence theory predicts a gradual rise in interdependence from north to south because pathogens rise gradually along with temperatures (8). Among Chinese provinces, overall pathogen rates and latitude are correlated: r(20) = –0.49, P = 0.02 (14). Furthermore, pathogen theory would predict the highest interdependence in the southwest, which has the highest rates of infectious disease death. Third, the rice theory predicts the highest interdependence in the south and east. Unlike pathogens, rice is not the highest in the southernmost provinces. Instead, rice is concentrated in the east around Shanghai, which has flat floodplains ideal for growing rice. The rice theory also predicts a sharp divide along the rice-wheat border, which is different from the gradual rise of pathogens with climate. To measure the prevalence of rice farming, we used statistical yearbook data on the percentage of cultivated land in each province devoted to rice paddies (13). Because some rice is grown with less labor on dry land (without paddies), we used statistics on rice paddies, rather than rice output. Because we wanted to assess the crop that different regions farmed traditionally, rather than figures affected by recent advances in irrigation and mechanization, we used rice statistics from 1996, the earliest available on the Bureau of Statistics Web site. To test the modernization hypothesis, we collected GDP per capita for each province from the same year. To measure precontemporary disease prevalence, we used the earliest study we could find with disease rates in different provinces, from 1976 (15). Because the 1976 study did not cover 10 provinces, we also collected recent statistics (13). This increased the sample by four provinces. Both sources gave similar pictures: higher disease in the south and the highest in the southwest. Samples We tested 1162 Han Chinese students from six sites: Beijing (north), Fujian (southeast), Guangdong (south), Yunnan (southwest), Sichuan (west central), and Liaoning (northeast). We used three measures: a measure of cultural thought, implicit individualism, and loyalty/nepotism (described below). We chose these tasks because they are not self-report scales, avoiding the documented problems with use of self-report scales to measure cultural differences (16). Results from these different sites show that rice-wheat differences held regardless of testing site (14). For all tasks, we analyzed only ethnic Han Chinese and excluded Han participants from the provinces of Tibet, Inner Mongolia, and Xinjiang. These areas are historically herding areas and have different ethnicities, cultures, languages, and religions that would confound our comparisons of rice and wheat. We tested the hypotheses with multilevel models because participants (level 1) were nested within provinces (level 2). We report correlations as an effect size at the province level that can be compared across variables. We calculated this by comparing the province-level variance of the Fig. 2. Cultural thought style by percentage of cultivated area devoted to rice paddies. Each circle represents a province. Circle size represents divorce and controls for effect of GDP. To illustrate cultural differences along the rice-wheat border, circles represent the rice and wheat border counties. www.sciencemag.org SCIENCE VOL 344 9 MAY 2014 605 RESEARCH ARTICLES