正在加载图片...
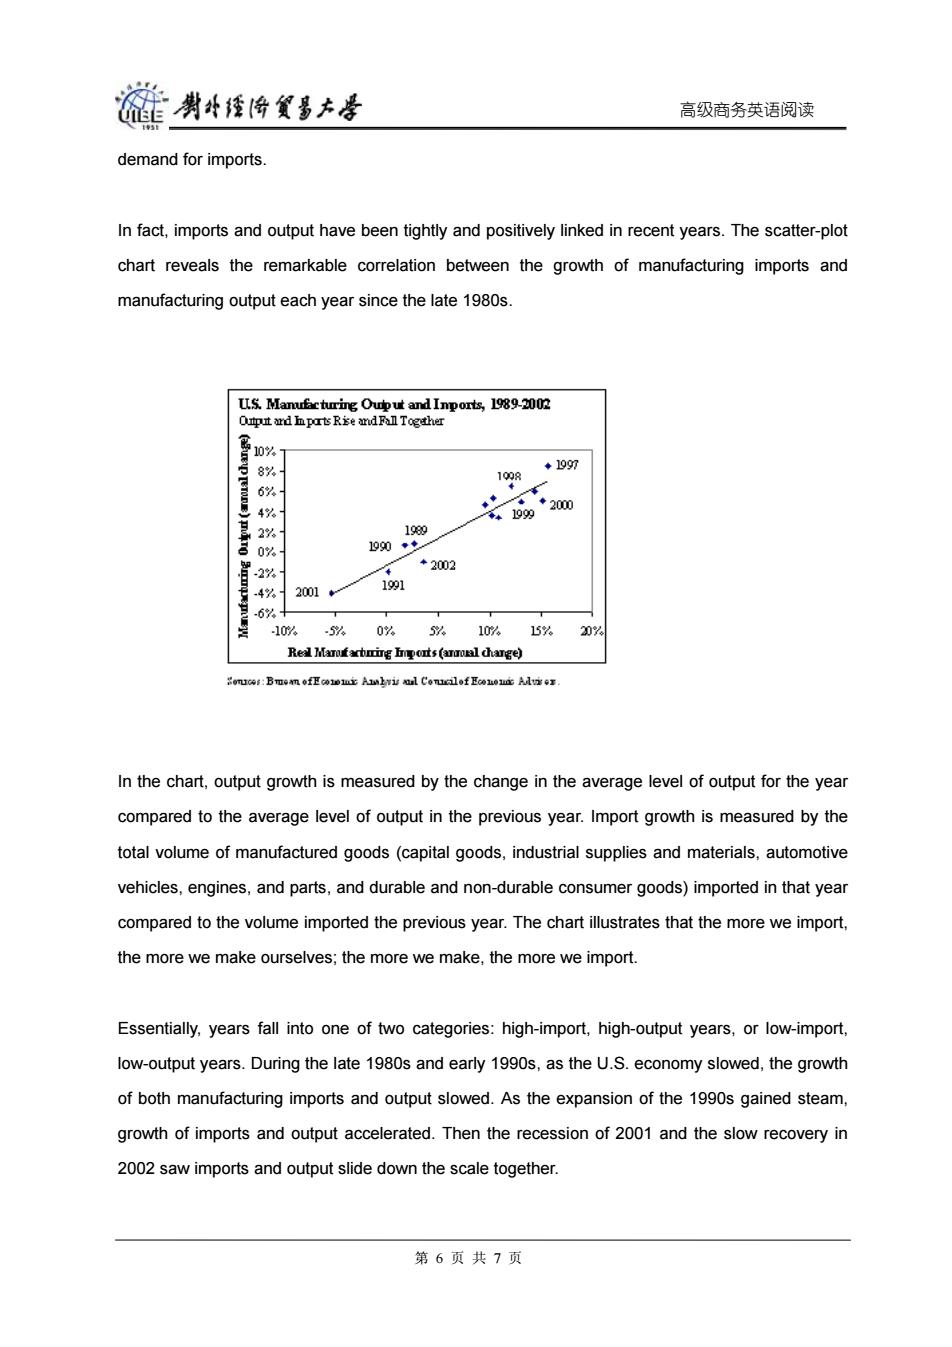
雒州4经降貿昌大是 高级商务英语阅读 demand for imports. In fact,imports and output have been tightly and positively linked in recent years.The scatter-plot chart reveals the remarkable correlation between the growth of manufacturing imports and manufacturing output each year since the late 1980s US.Manuficturing Ouiput and Inports,1989-2002 Qt中t证dnpt老Rise and Fall Together 10% 8% ◆1097 198 6% 4% 云m0 2% 198o 1090◆◆】 -2%1 ◆2002 .4% 2001 191 10%。 5。 0以 5Y410/% 15% 20 Re]重rt立gots(anroal charge) In the chart,output growth is measured by the change in the average level of output for the year compared to the average level of output in the previous year.Import growth is measured by the total volume of manufactured goods(capital goods,industrial supplies and materials,automotive vehicles,engines,and parts,and durable and non-durable consumer goods)imported in that year compared to the volume imported the previous year.The chart illustrates that the more we import, the more we make ourselves;the more we make,the more we import. Essentially,years fall into one of two categories:high-import,high-output years,or low-import, low-output years.During the late 1980s and early 1990s,as the U.S.economy slowed,the growth of both manufacturing imports and output slowed.As the expansion of the 1990s gained steam, growth of imports and output accelerated.Then the recession of 2001 and the slow recovery in 2002 saw imports and output slide down the scale together. 第6页共7页高级商务英语阅读 demand for imports. In fact, imports and output have been tightly and positively linked in recent years. The scatter-plot chart reveals the remarkable correlation between the growth of manufacturing imports and manufacturing output each year since the late 1980s. In the chart, output growth is measured by the change in the average level of output for the year compared to the average level of output in the previous year. Import growth is measured by the total volume of manufactured goods (capital goods, industrial supplies and materials, automotive vehicles, engines, and parts, and durable and non-durable consumer goods) imported in that year compared to the volume imported the previous year. The chart illustrates that the more we import, the more we make ourselves; the more we make, the more we import. Essentially, years fall into one of two categories: high-import, high-output years, or low-import, low-output years. During the late 1980s and early 1990s, as the U.S. economy slowed, the growth of both manufacturing imports and output slowed. As the expansion of the 1990s gained steam, growth of imports and output accelerated. Then the recession of 2001 and the slow recovery in 2002 saw imports and output slide down the scale together. 第 6 页 共 7 页