正在加载图片...
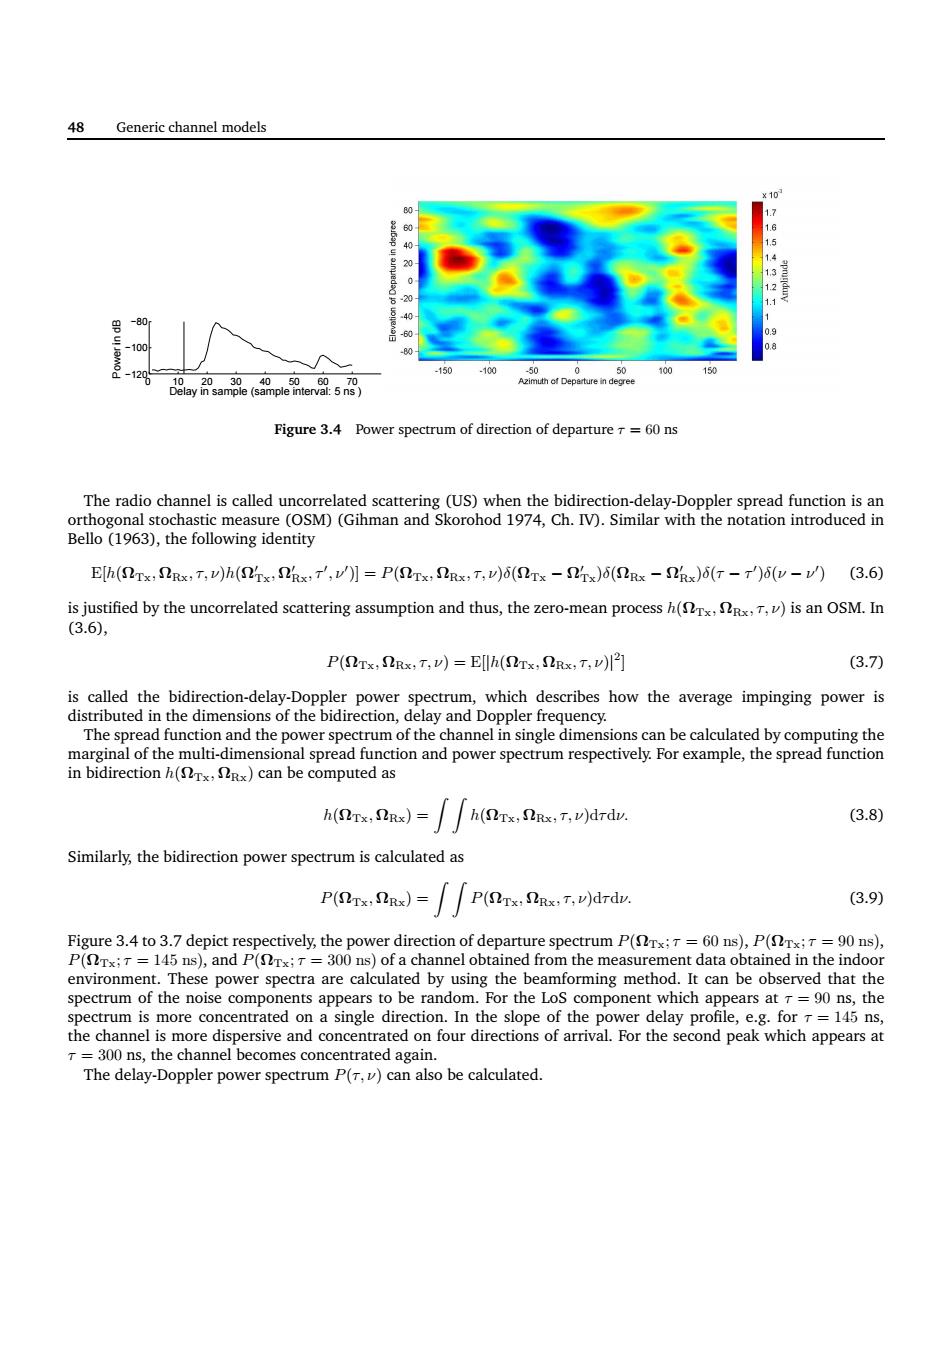
48 Generic channel models Figure 3.4 Power spectrum of direction of Bello (3),the following identity Elh(NTx:SRs:T:v)h(x:x'v)]P(STx:SRx.T.v)6(NTs-rx)6(SRxs -ix)6(T-)6(v-v)(3.6) is justified by the uncorrelated scattering assumption and thus,the zero-mean process)is an OSM.In (3.6), P(Tx,nRx,T,v)=Eh(LTx,Rx,T,w的 (3.7) 、中the,how the ege pgng power h(,S)=h(fs,Sne.T.vdrdv. 3.8) Similarly,the bidirection power spectrum is calculated as Pr,a=∫∫P(.)drdv 3.9 rture spectrum P(Tx;T=60 ns),P(Tx;T =90 ns), The delay-Doppler power spectrum P()can also be calculated. 48 Generic channel models 0 10 20 30 40 50 60 70 −120 −100 −80 Delay in sample (sample interval: 5 ns ) Power in dB Figure 3.4 Power spectrum of direction of departure τ = 60 ns The radio channel is called uncorrelated scattering (US) when the bidirection-delay-Doppler spread function is an orthogonal stochastic measure (OSM) (Gihman and Skorohod 1974, Ch. IV). Similar with the notation introduced in Bello (1963), the following identity E[h(ΩTx, ΩRx, τ, ν)h(Ω′ Tx, Ω′ Rx, τ′ , ν′ )] = P(ΩTx, ΩRx, τ, ν)δ(ΩTx − Ω′ Tx)δ(ΩRx − Ω′ Rx)δ(τ − τ ′ )δ(ν − ν ′ ) (3.6) is justified by the uncorrelated scattering assumption and thus, the zero-mean process h(ΩTx, ΩRx, τ, ν) is an OSM. In (3.6), P(ΩTx, ΩRx, τ, ν) = E[|h(ΩTx, ΩRx, τ, ν)| 2 ] (3.7) is called the bidirection-delay-Doppler power spectrum, which describes how the average impinging power is distributed in the dimensions of the bidirection, delay and Doppler frequency. The spread function and the power spectrum of the channel in single dimensions can be calculated by computing the marginal of the multi-dimensional spread function and power spectrum respectively. For example, the spread function in bidirection h(ΩTx, ΩRx) can be computed as h(ΩTx, ΩRx) = Z Z h(ΩTx, ΩRx, τ, ν)dτdν. (3.8) Similarly, the bidirection power spectrum is calculated as P(ΩTx, ΩRx) = Z Z P(ΩTx, ΩRx, τ, ν)dτdν. (3.9) Figure 3.4 to 3.7 depict respectively, the power direction of departure spectrum P(ΩTx; τ = 60 ns), P(ΩTx; τ = 90 ns), P(ΩTx; τ = 145 ns), and P(ΩTx; τ = 300 ns) of a channel obtained from the measurement data obtained in the indoor environment. These power spectra are calculated by using the beamforming method. It can be observed that the spectrum of the noise components appears to be random. For the LoS component which appears at τ = 90 ns, the spectrum is more concentrated on a single direction. In the slope of the power delay profile, e.g. for τ = 145 ns, the channel is more dispersive and concentrated on four directions of arrival. For the second peak which appears at τ = 300 ns, the channel becomes concentrated again. The delay-Doppler power spectrum P(τ, ν) can also be calculated