正在加载图片...
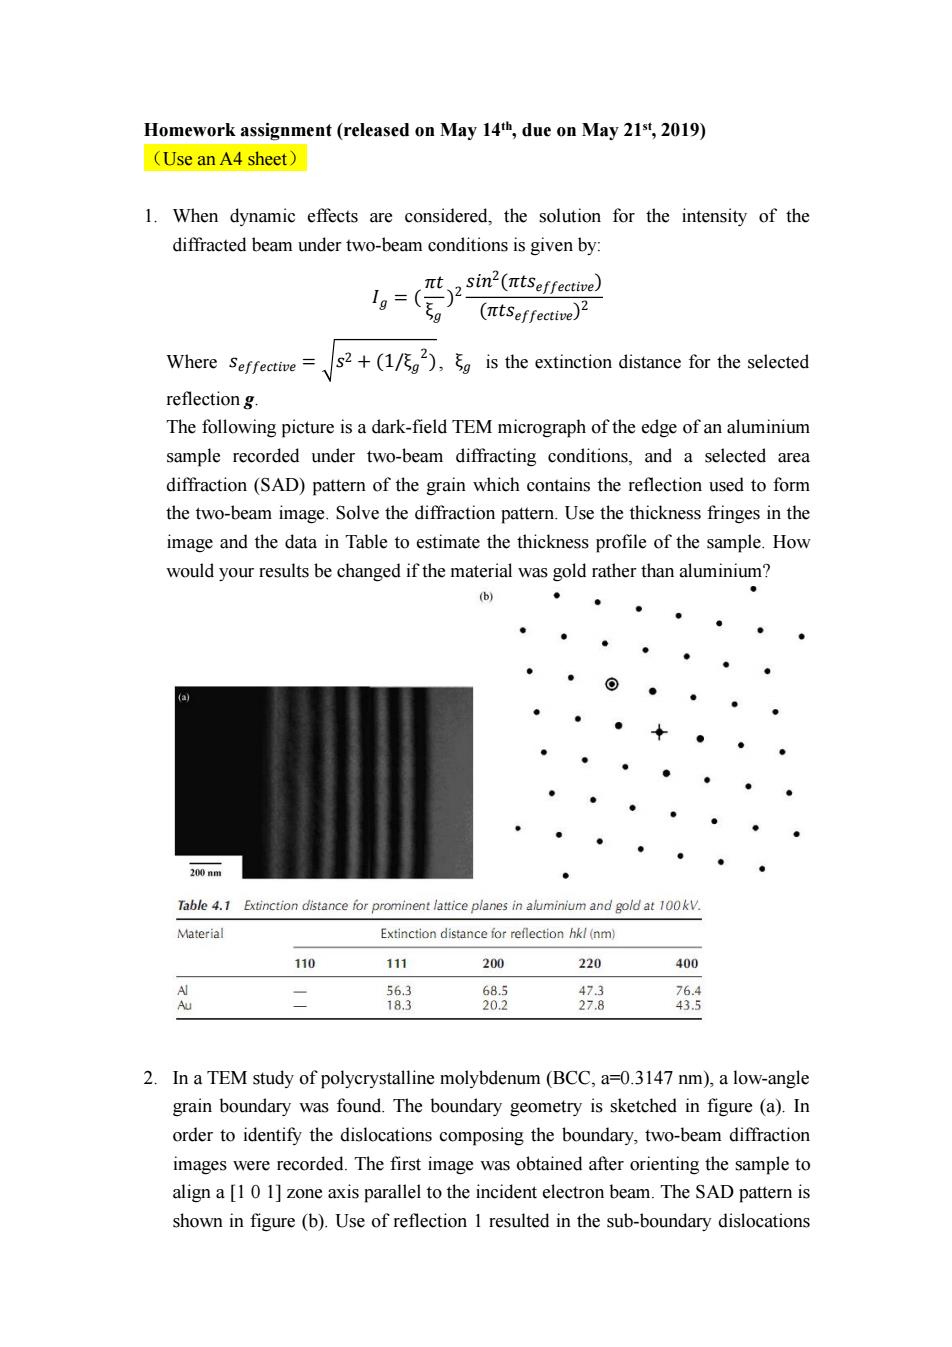
Homework assignment(released on May 14th,due on May 21st,2019) (Use an A4 sheet) 1.When dynamic effects are considered,the solution for the intensity of the diffracted beam under two-beam conditions is given by: t2sin2(πtSeffecve) 1g=(0 (ntseffective)2 Where Seffective= s2+(1/),is the extinction distance for the selected reflection g. The following picture is a dark-field TEM micrograph of the edge of an aluminium sample recorded under two-beam diffracting conditions,and a selected area diffraction(SAD)pattern of the grain which contains the reflection used to form the two-beam image.Solve the diffraction pattern.Use the thickness fringes in the image and the data in Table to estimate the thickness profile of the sample.How would your results be changed if the material was gold rather than aluminium? (b) 200nm ● Table 4.1 Extinction distance for prominent lattice planes in aluminium and gold at 100kV. Material Extinction distance for reflection hkl(nm) 110 111 200 220 400 A Au 二 56.3 68.5 18.3 20.2 好8 2.In a TEM study of polycrystalline molybdenum(BCC,a=0.3147 nm),a low-angle grain boundary was found.The boundary geometry is sketched in figure(a).In order to identify the dislocations composing the boundary,two-beam diffraction images were recorded.The first image was obtained after orienting the sample to align a [1 0 1]zone axis parallel to the incident electron beam.The SAD pattern is shown in figure(b).Use of reflection 1 resulted in the sub-boundary dislocationsHomework assignment (released on May 14 th , due on May 21 st, 2019) (Use an A4 sheet) 1. When dynamic effects are considered, the solution for the intensity of the diffracted beam under two-beam conditions is given by: = th MMgtU MMgtU Where MMgtU = h , is the extinction distance for the selected reflection g. The following picture is a dark-field TEM micrograph of the edge of an aluminium sample recorded under two-beam diffracting conditions, and a selected area diffraction (SAD) pattern of the grain which contains the reflection used to form the two-beam image. Solve the diffraction pattern. Use the thickness fringes in the image and the data in Table to estimate the thickness profile of the sample. How would your results be changed if the material was gold rather than aluminium? 2. In a TEM study of polycrystalline molybdenum (BCC, a=0.3147 nm), a low-angle grain boundary was found. The boundary geometry is sketched in figure (a). In order to identify the dislocations composing the boundary, two-beam diffraction images were recorded. The first image was obtained after orienting the sample to align a [1 0 1] zone axis parallel to the incident electron beam. The SAD pattern is shown in figure (b). Use of reflection 1 resulted in the sub-boundary dislocations