正在加载图片...
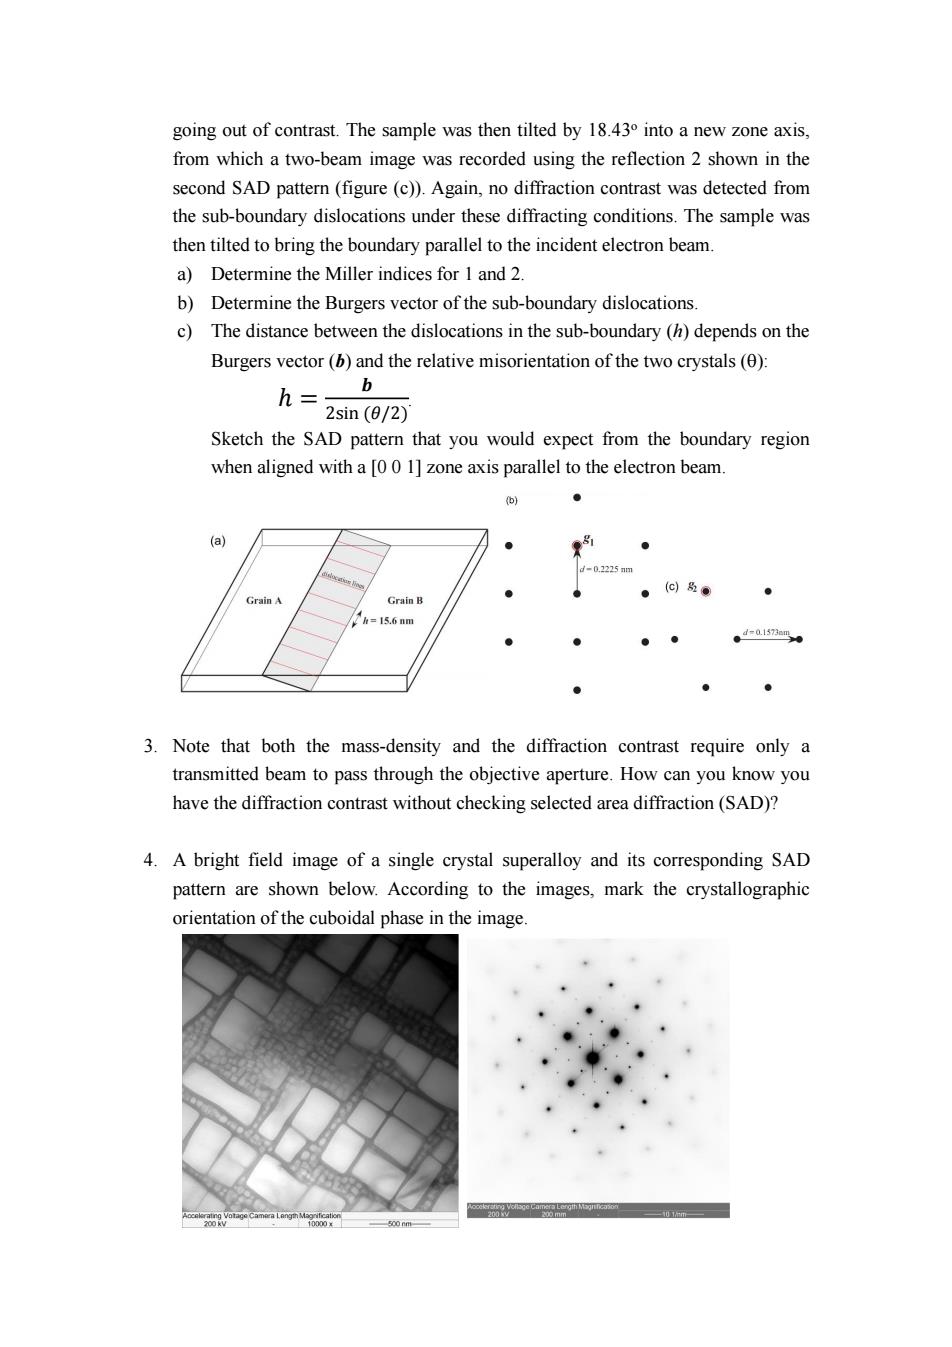
going out of contrast.The sample was then tilted by 18.430 into a new zone axis, from which a two-beam image was recorded using the reflection 2 shown in the second SAD pattern(figure(c)).Again,no diffraction contrast was detected from the sub-boundary dislocations under these diffracting conditions.The sample was then tilted to bring the boundary parallel to the incident electron beam. a)Determine the Miller indices for 1 and 2. b)Determine the Burgers vector of the sub-boundary dislocations. c)The distance between the dislocations in the sub-boundary(h)depends on the Burgers vector(b)and the relative misorientation of the two crystals(0) h=-b 2sin(0/2) Sketch the SAD pattern that you would expect from the boundary region when aligned with a [0 0 1]zone axis parallel to the electron beam. o)● (a) ● d-0.225mm GrainA Grain B -15.6mm 。4=a.573 3.Note that both the mass-density and the diffraction contrast require only a transmitted beam to pass through the objective aperture.How can you know you have the diffraction contrast without checking selected area diffraction(SAD)? 4.A bright field image of a single crystal superalloy and its corresponding SAD pattern are shown below.According to the images,mark the crystallographic orientation of the cuboidal phase in the image. 10000元 500nmgoing out of contrast. The sample was then tilted by 18.43 o into a new zone axis, from which a two-beam image was recorded using the reflection 2 shown in the second SAD pattern (figure (c)). Again, no diffraction contrast was detected from the sub-boundary dislocations under these diffracting conditions. The sample was then tilted to bring the boundary parallel to the incident electron beam. a) Determine the Miller indices for 1 and 2. b) Determine the Burgers vector of the sub-boundary dislocations. c) The distance between the dislocations in the sub-boundary (h) depends on the Burgers vector (b) and the relative misorientation of the two crystals (): = sin . Sketch the SAD pattern that you would expect from the boundary region when aligned with a [0 0 1] zone axis parallel to the electron beam. 3. Note that both the mass-density and the diffraction contrast require only a transmitted beam to pass through the objective aperture. How can you know you have the diffraction contrast without checking selected area diffraction (SAD)? 4. A bright field image of a single crystal superalloy and its corresponding SAD pattern are shown below. According to the images, mark the crystallographic orientation of the cuboidal phase in the image