正在加载图片...

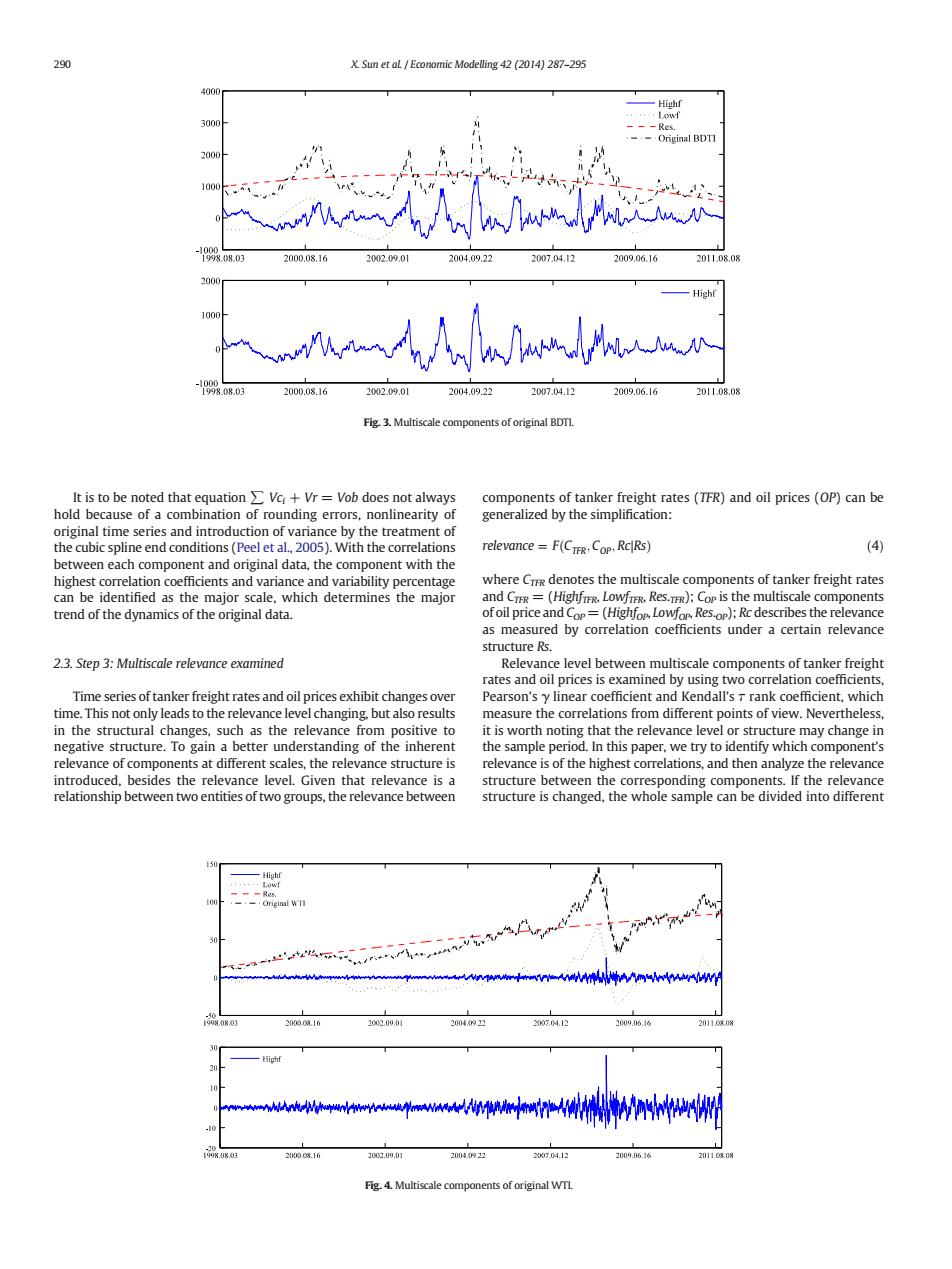
290 X.Sun et aL Economic Modelling 42 (2014)287-295 4000 Highf Lowf 3000 --Res. --Original BDTI 2000 1000 人M心 -1000 1998.08D3 2000.08.16 202.090T 2004.09.22 2007.04.12 2009.06.16 2011.08.08 2000 wn人fbohfno 9908.03 2000.08.16 2002.09.01 2004.09.22 2007.04.12 2009.06.16 2011.08.08 Fig.3.Multiscale components of original BDTI. It is to be noted that equation Vc +Vr Vob does not always components of tanker freight rates (TFR)and oil prices (OP)can be hold because of a combination of rounding errors,nonlinearity of generalized by the simplification: original time series and introduction of variance by the treatment of the cubic spline end conditions(Peel et al.,2005).With the correlations relevance=F(CTFR Cop.RcRs) (4) between each component and original data,the component with the highest correlation coefficients and variance and variability percentage where Cr denotes the multiscale components of tanker freight rates can be identified as the major scale,which determines the major and CTER =(HighfTER.LowfTER,Res.TER):Cop is the multiscale components trend of the dynamics of the original data. ofoil price and Cop=(Highfor Lowfop Res.op):Rc describes the relevance as measured by correlation coefficients under a certain relevance structure Rs. 2.3.Step 3:Multiscale relevance examined Relevance level between multiscale components of tanker freight rates and oil prices is examined by using two correlation coefficients. Time series of tanker freight rates and oil prices exhibit changes over Pearson's y linear coefficient and Kendall's T rank coefficient,which time.This not only leads to the relevance level changing.but also results measure the correlations from different points of view.Nevertheless, in the structural changes.such as the relevance from positive to it is worth noting that the relevance level or structure may change in negative structure.To gain a better understanding of the inherent the sample period.In this paper,we try to identify which component's relevance of components at different scales,the relevance structure is relevance is of the highest correlations,and then analyze the relevance introduced,besides the relevance level.Given that relevance is a structure between the corresponding components.If the relevance relationship between two entities of two groups,the relevance between structure is changed,the whole sample can be divided into different High --Res. .-·0 riginal W1 9808.01 200008.16 202.09.01 2004.0922 200m.M.12 2009.06.16 20110s08 Highf -10 2002.09.01 2004.22 207.D4.12 2009,6.16 2011040% Fig.4.Multiscale components of original WTI.It is to be noted that equation ∑ Vci + Vr = Vob does not always hold because of a combination of rounding errors, nonlinearity of original time series and introduction of variance by the treatment of the cubic spline end conditions (Peel et al., 2005). With the correlations between each component and original data, the component with the highest correlation coefficients and variance and variability percentage can be identified as the major scale, which determines the major trend of the dynamics of the original data. 2.3. Step 3: Multiscale relevance examined Time series of tanker freight rates and oil prices exhibit changes over time. This not only leads to the relevance level changing, but also results in the structural changes, such as the relevance from positive to negative structure. To gain a better understanding of the inherent relevance of components at different scales, the relevance structure is introduced, besides the relevance level. Given that relevance is a relationship between two entities of two groups, the relevance between components of tanker freight rates (TFR) and oil prices (OP) can be generalized by the simplification: relevance ¼ F CTFR; COP ðÞ ð ; RcjRs 4Þ where CTFR denotes the multiscale components of tanker freight rates and CTFR = (HighfTFR, LowfTFR, Res.TFR); COP is the multiscale components of oil price and COP = (HighfOP, LowfOP, Res.OP); Rc describes the relevance as measured by correlation coefficients under a certain relevance structure Rs. Relevance level between multiscale components of tanker freight rates and oil prices is examined by using two correlation coefficients, Pearson's γ linear coefficient and Kendall's τ rank coefficient, which measure the correlations from different points of view. Nevertheless, it is worth noting that the relevance level or structure may change in the sample period. In this paper, we try to identify which component's relevance is of the highest correlations, and then analyze the relevance structure between the corresponding components. If the relevance structure is changed, the whole sample can be divided into different Fig. 3. Multiscale components of original BDTI. Fig. 4. Multiscale components of original WTI. 290 X. Sun et al. / Economic Modelling 42 (2014) 287–295