正在加载图片...
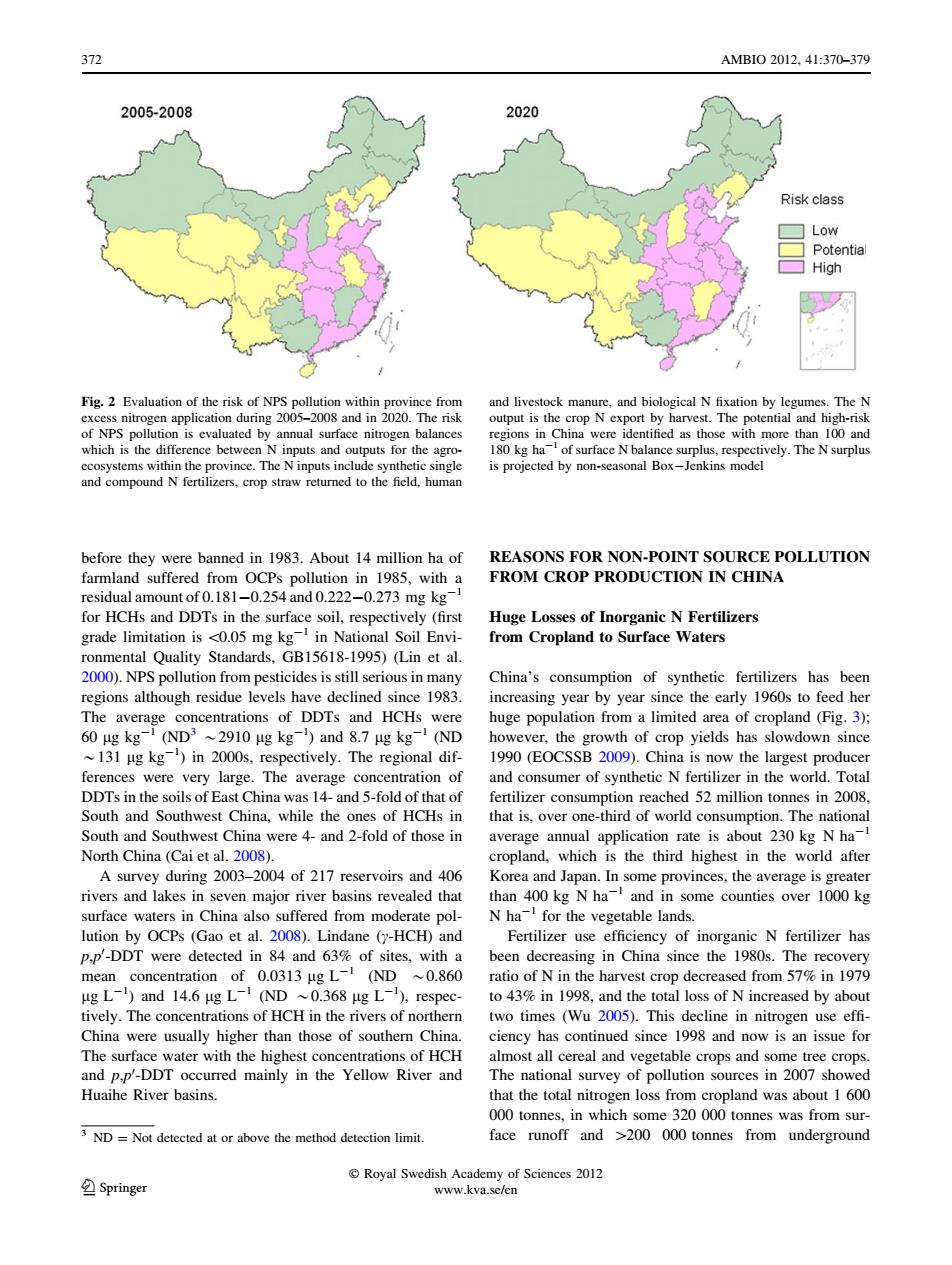
372 AMBI02012.41:370-379 2005-2008 2020 Risk class Low Potential High Fig.2 Evaluation of the risk of NPS pollution within province from and livestock manure,and biological N fixation by legumes.The N excess nitrogen application during 2005-2008 and in 2020.The risk output is the crop N export by harvest.The potential and high-risk of NPS pollution is evaluated by annual surface nitrogen balances regions in China were identified as those with more than 100 and which is the difference between N inputs and outputs for the agro- 180 kg ha-of surface N balance surplus,respectively.The N surplus ecosystems within the province.The N inputs include synthetic single is projected by non-seasonal Box-Jenkins model and compound N fertilizers,crop straw returned to the field,human before they were banned in 1983.About 14 million ha of REASONS FOR NON-POINT SOURCE POLLUTION farmland suffered from OCPs pollution in 1985,with a FROM CROP PRODUCTION IN CHINA residual amount of 0.181-0.254 and 0.222-0.273 mg kg- for HCHs and DDTs in the surface soil,respectively(first Huge Losses of Inorganic N Fertilizers grade limitation is <0.05 mg kg-in National Soil Envi- from Cropland to Surface Waters ronmental Quality Standards,GB15618-1995)(Lin et al. 2000).NPS pollution from pesticides is still serious in many China's consumption of synthetic fertilizers has been regions although residue levels have declined since 1983. increasing year by year since the early 1960s to feed her The average concentrations of DDTs and HCHs were huge population from a limited area of cropland(Fig.3); 60 ug kg-1 (ND3 ~2910 ug kg-)and 8.7 ug kg-1 (ND however,the growth of crop yields has slowdown since 131 ug kg)in 2000s,respectively.The regional dif- 1990(EOCSSB 2009).China is now the largest producer ferences were very large.The average concentration of and consumer of synthetic N fertilizer in the world.Total DDTs in the soils of East China was 14-and 5-fold of that of fertilizer consumption reached 52 million tonnes in 2008. South and Southwest China,while the ones of HCHs in that is,over one-third of world consumption.The national South and Southwest China were 4-and 2-fold of those in average annual application rate is about 230 kg N ha- North China (Cai et al.2008). cropland,which is the third highest in the world after A survey during 2003-2004 of 217 reservoirs and 406 Korea and Japan.In some provinces,the average is greater rivers and lakes in seven major river basins revealed that than 400 kg N ha-and in some counties over 1000 kg surface waters in China also suffered from moderate pol- N ha for the vegetable lands. lution by OCPs (Gao et al.2008).Lindane (y-HCH)and Fertilizer use efficiency of inorganic N fertilizer has p.p'-DDT were detected in 84 and 63%of sites,with a been decreasing in China since the 1980s.The recovery mean concentration of 0.0313 ug L-1 (ND ~0.860 ratio of N in the harvest crop decreased from 57%in 1979 ug L-)and 14.6 ug L-(ND ~0.368 ug L),respec-to 43%in 1998,and the total loss of N increased by about tively.The concentrations of HCH in the rivers of northern two times (Wu 2005).This decline in nitrogen use effi- China were usually higher than those of southern China. ciency has continued since 1998 and now is an issue for The surface water with the highest concentrations of HCH almost all cereal and vegetable crops and some tree crops. and p,p'-DDT occurred mainly in the Yellow River and The national survey of pollution sources in 2007 showed Huaihe River basins. that the total nitrogen loss from cropland was about 1 600 000 tonnes,in which some 320 000 tonnes was from sur- 3 ND=Not detected at or above the method detection limit. face runoff and >200 000 tonnes from underground Royal Swedish Academy of Sciences 2012 Springer www.kva.se/enbefore they were banned in 1983. About 14 million ha of farmland suffered from OCPs pollution in 1985, with a residual amount of 0.181-0.254 and 0.222-0.273 mg kg-1 for HCHs and DDTs in the surface soil, respectively (first grade limitation is \0.05 mg kg-1 in National Soil Environmental Quality Standards, GB15618-1995) (Lin et al. 2000). NPS pollution from pesticides is still serious in many regions although residue levels have declined since 1983. The average concentrations of DDTs and HCHs were 60 lg kg-1 (ND3 *2910 lg kg-1 ) and 8.7 lg kg-1 (ND *131 lg kg-1 ) in 2000s, respectively. The regional differences were very large. The average concentration of DDTs in the soils of East China was 14- and 5-fold of that of South and Southwest China, while the ones of HCHs in South and Southwest China were 4- and 2-fold of those in North China (Cai et al. 2008). A survey during 2003–2004 of 217 reservoirs and 406 rivers and lakes in seven major river basins revealed that surface waters in China also suffered from moderate pollution by OCPs (Gao et al. 2008). Lindane (c-HCH) and p,p0 -DDT were detected in 84 and 63% of sites, with a mean concentration of 0.0313 lg L-1 (ND *0.860 lg L-1 ) and 14.6 lg L-1 (ND *0.368 lg L-1 ), respectively. The concentrations of HCH in the rivers of northern China were usually higher than those of southern China. The surface water with the highest concentrations of HCH and p,p0 -DDT occurred mainly in the Yellow River and Huaihe River basins. REASONS FOR NON-POINT SOURCE POLLUTION FROM CROP PRODUCTION IN CHINA Huge Losses of Inorganic N Fertilizers from Cropland to Surface Waters China’s consumption of synthetic fertilizers has been increasing year by year since the early 1960s to feed her huge population from a limited area of cropland (Fig. 3); however, the growth of crop yields has slowdown since 1990 (EOCSSB 2009). China is now the largest producer and consumer of synthetic N fertilizer in the world. Total fertilizer consumption reached 52 million tonnes in 2008, that is, over one-third of world consumption. The national average annual application rate is about 230 kg N ha-1 cropland, which is the third highest in the world after Korea and Japan. In some provinces, the average is greater than 400 kg N ha-1 and in some counties over 1000 kg N ha-1 for the vegetable lands. Fertilizer use efficiency of inorganic N fertilizer has been decreasing in China since the 1980s. The recovery ratio of N in the harvest crop decreased from 57% in 1979 to 43% in 1998, and the total loss of N increased by about two times (Wu 2005). This decline in nitrogen use effi- ciency has continued since 1998 and now is an issue for almost all cereal and vegetable crops and some tree crops. The national survey of pollution sources in 2007 showed that the total nitrogen loss from cropland was about 1 600 000 tonnes, in which some 320 000 tonnes was from surface runoff and [200 000 tonnes from underground Fig. 2 Evaluation of the risk of NPS pollution within province from excess nitrogen application during 2005–2008 and in 2020. The risk of NPS pollution is evaluated by annual surface nitrogen balances which is the difference between N inputs and outputs for the agroecosystems within the province. The N inputs include synthetic single and compound N fertilizers, crop straw returned to the field, human and livestock manure, and biological N fixation by legumes. The N output is the crop N export by harvest. The potential and high-risk regions in China were identified as those with more than 100 and 180 kg ha-1 of surface N balance surplus, respectively. The N surplus is projected by non-seasonal Box-Jenkins model 3 ND = Not detected at or above the method detection limit. 372 AMBIO 2012, 41:370–379 123 Royal Swedish Academy of Sciences 2012 www.kva.se/en�