正在加载图片...
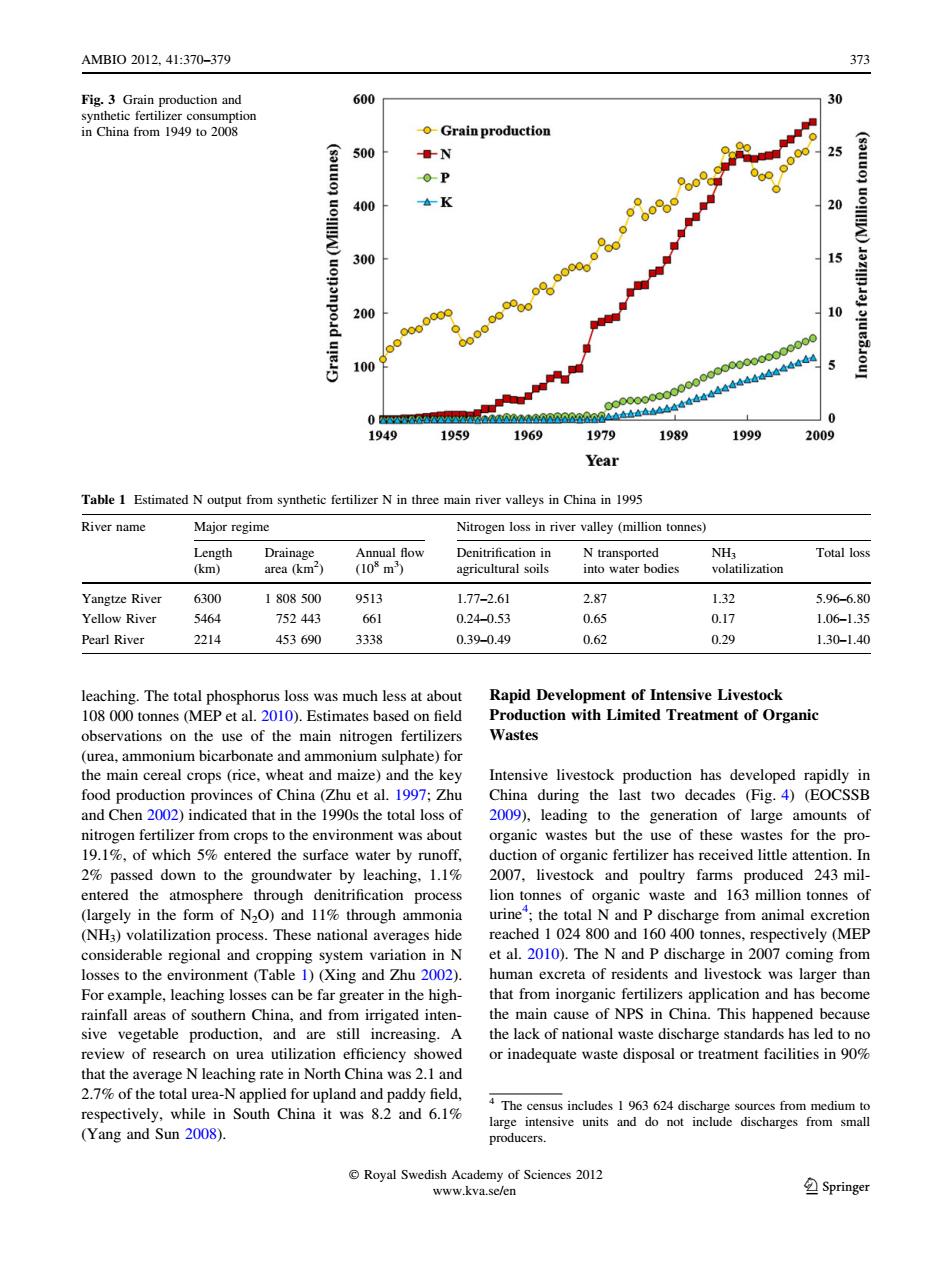
AMBI02012,41:370-379 373 Fig.3 Grain production and 600 30 synthetic fertilizer consumption in China from 1949 to 2008 oGrain production 500 N 25 OP 400 在K 20 300 15 200 o 100 ooooocooooooooxoooocooo 4444 V9K376000020090000020086444444444444443394444 0 1949 1959 1969 1979 1989 1999 2009 Year Table 1 Estimated N output from synthetic fertilizer N in three main river valleys in China in 1995 River name Major regime Nitrogen loss in river valley (million tonnes) Length Drainage Annual flow Denitrification in N transported NH Total loss (km) area (km) (108m) agricultural soils into water bodies volatilization Yangtze River 6300 1808500 9513 1.77-2.61 2.87 1.32 5.96-6.80 Yellow River 5464 752443 661 0.24-0.53 0.65 0.17 1.06-1.35 Pearl River 2214 453690 3338 0.39-0.49 0.62 0.29 1.30-1.40 leaching.The total phosphorus loss was much less at about Rapid Development of Intensive Livestock 108 000 tonnes (MEP et al.2010).Estimates based on field Production with Limited Treatment of Organic observations on the use of the main nitrogen fertilizers Wastes (urea,ammonium bicarbonate and ammonium sulphate)for the main cereal crops(rice,wheat and maize)and the key Intensive livestock production has developed rapidly in food production provinces of China(Zhu et al.1997;Zhu China during the last two decades (Fig.4)(EOCSSB and Chen 2002)indicated that in the 1990s the total loss of 2009),leading to the generation of large amounts of nitrogen fertilizer from crops to the environment was about organic wastes but the use of these wastes for the pro- 19.1%,of which 5%entered the surface water by runoff, duction of organic fertilizer has received little attention.In 2%passed down to the groundwater by leaching,1.1% 2007,livestock and poultry farms produced 243 mil- entered the atmosphere through denitrification process lion tonnes of organic waste and 163 million tonnes of (largely in the form of N2O)and 11%through ammonia urine;the total N and P discharge from animal excretion (NH3)volatilization process.These national averages hide reached 1 024 800 and 160 400 tonnes,respectively (MEP considerable regional and cropping system variation in N et al.2010).The N and P discharge in 2007 coming from losses to the environment (Table 1)(Xing and Zhu 2002). human excreta of residents and livestock was larger than For example,leaching losses can be far greater in the high- that from inorganic fertilizers application and has become rainfall areas of southern China,and from irrigated inten- the main cause of NPS in China.This happened because sive vegetable production,and are still increasing.A the lack of national waste discharge standards has led to no review of research on urea utilization efficiency showed or inadequate waste disposal or treatment facilities in 90% that the average N leaching rate in North China was 2.1 and 2.7%of the total urea-N applied for upland and paddy field, respectively,while in South China it was 8.2 and 6.1% 4 The census includes 1963624 discharge sources from medium to large intensive units and do not include discharges from small (Yang and Sun 2008). producers. Royal Swedish Academy of Sciences 2012 www.kva.se/en ②Springerleaching. The total phosphorus loss was much less at about 108 000 tonnes (MEP et al. 2010). Estimates based on field observations on the use of the main nitrogen fertilizers (urea, ammonium bicarbonate and ammonium sulphate) for the main cereal crops (rice, wheat and maize) and the key food production provinces of China (Zhu et al. 1997; Zhu and Chen 2002) indicated that in the 1990s the total loss of nitrogen fertilizer from crops to the environment was about 19.1%, of which 5% entered the surface water by runoff, 2% passed down to the groundwater by leaching, 1.1% entered the atmosphere through denitrification process (largely in the form of N2O) and 11% through ammonia (NH3) volatilization process. These national averages hide considerable regional and cropping system variation in N losses to the environment (Table 1) (Xing and Zhu 2002). For example, leaching losses can be far greater in the highrainfall areas of southern China, and from irrigated intensive vegetable production, and are still increasing. A review of research on urea utilization efficiency showed that the average N leaching rate in North China was 2.1 and 2.7% of the total urea-N applied for upland and paddy field, respectively, while in South China it was 8.2 and 6.1% (Yang and Sun 2008). Rapid Development of Intensive Livestock Production with Limited Treatment of Organic Wastes Intensive livestock production has developed rapidly in China during the last two decades (Fig. 4) (EOCSSB 2009), leading to the generation of large amounts of organic wastes but the use of these wastes for the production of organic fertilizer has received little attention. In 2007, livestock and poultry farms produced 243 million tonnes of organic waste and 163 million tonnes of urine4 ; the total N and P discharge from animal excretion reached 1 024 800 and 160 400 tonnes, respectively (MEP et al. 2010). The N and P discharge in 2007 coming from human excreta of residents and livestock was larger than that from inorganic fertilizers application and has become the main cause of NPS in China. This happened because the lack of national waste discharge standards has led to no or inadequate waste disposal or treatment facilities in 90% Fig. 3 Grain production and synthetic fertilizer consumption in China from 1949 to 2008 Table 1 Estimated N output from synthetic fertilizer N in three main river valleys in China in 1995 River name Major regime Nitrogen loss in river valley (million tonnes) Length (km) Drainage area (km2 ) Annual flow (108 m3 ) Denitrification in agricultural soils N transported into water bodies NH3 volatilization Total loss Yangtze River 6300 1 808 500 9513 1.77–2.61 2.87 1.32 5.96–6.80 Yellow River 5464 752 443 661 0.24–0.53 0.65 0.17 1.06–1.35 Pearl River 2214 453 690 3338 0.39–0.49 0.62 0.29 1.30–1.40 4 The census includes 1 963 624 discharge sources from medium to large intensive units and do not include discharges from small producers. AMBIO 2012, 41:370–379 373 Royal Swedish Academy of Sciences 2012 www.kva.se/en 123�