正在加载图片...
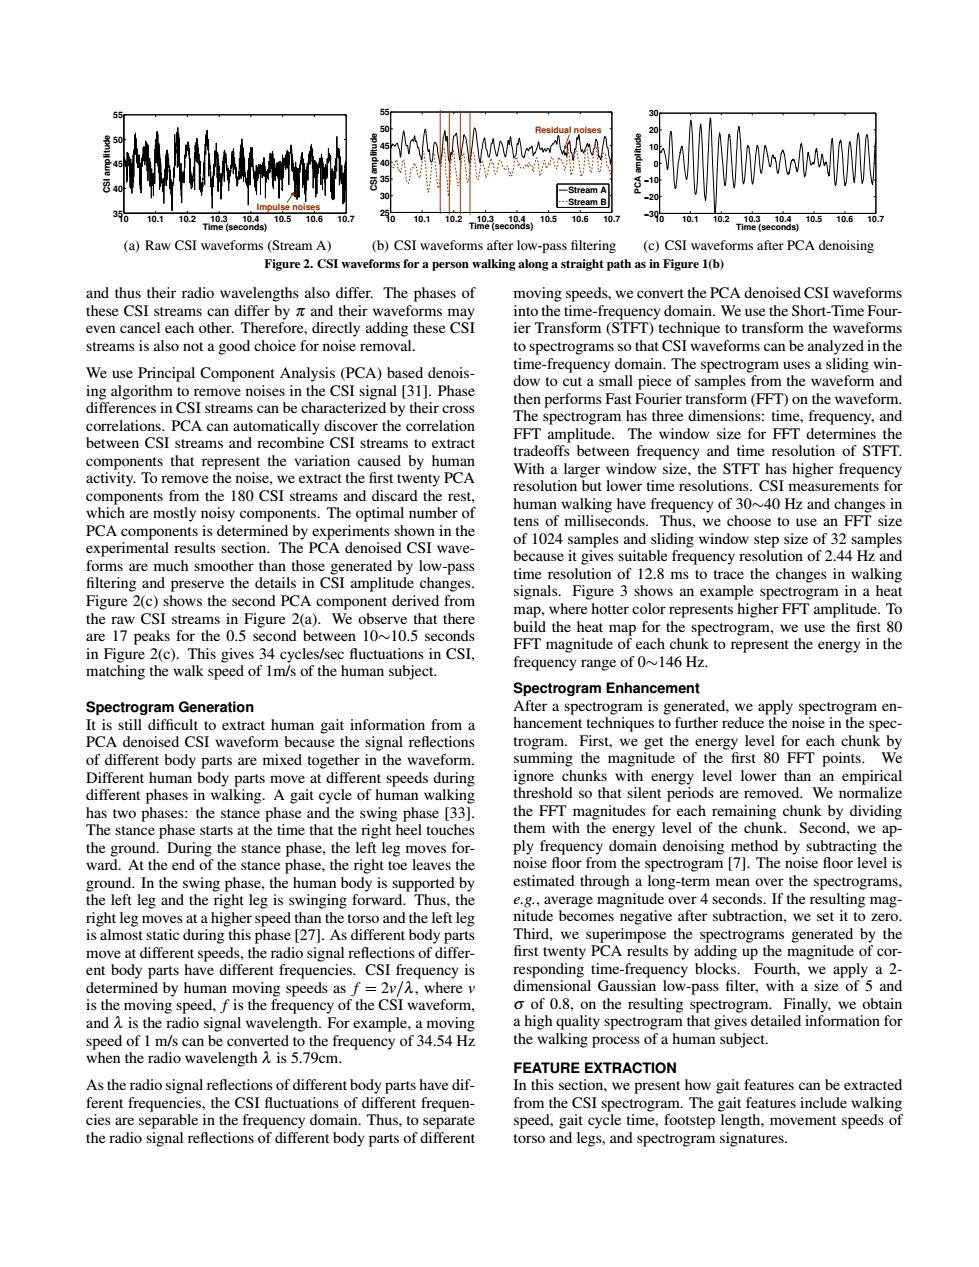
Stream A 30 -Stream B 10.1 10.2 10.5 10.6 10.7 20 10.1 10.2 10.5 10.6 107 10.1 10.9 10.3 10.5 10.6 (a)Raw CSI waveforms(Stream A) (b)CSI waveforms after low-pass filtering (c)CSI waveforms after PCA denoising Figure 2.CSI waveforms for a person walking along a straight path as in Figure 1(b) and thus their radio wavelengths also differ.The phases of moving speeds,we convert the PCA denoised CSI waveforms these CSI streams can differ by a and their waveforms may into the time-frequency domain.We use the Short-Time Four- even cancel each other.Therefore,directly adding these CSI ier Transform(STFT)technique to transform the waveforms streams is also not a good choice for noise removal. to spectrograms so that CSI waveforms can be analyzed in the We use Principal Component Analysis(PCA)based denois- time-frequency domain.The spectrogram uses a sliding win- dow to cut a small piece of samples from the waveform and ing algorithm to remove noises in the CSI signal [311.Phase differences in CSI streams can be characterized by their cross then performs Fast Fourier transform(FFT)on the waveform. correlations.PCA can automatically discover the correlation The spectrogram has three dimensions:time,frequency,and between CSI streams and recombine CSI streams to extract FFT amplitude.The window size for FFT determines the components that represent the variation caused by human tradeoffs between frequency and time resolution of STFT. activity.To remove the noise,we extract the first twenty PCA With a larger window size,the STFT has higher frequency resolution but lower time resolutions.CSI measurements for components from the 180 CSI streams and discard the rest, human walking have frequency of 30~40 Hz and changes in which are mostly noisy components.The optimal number of tens of milliseconds.Thus,we choose to use an FFT size PCA components is determined by experiments shown in the experimental results section.The PCA denoised CSI wave- of 1024 samples and sliding window step size of 32 samples forms are much smoother than those generated by low-pass because it gives suitable frequency resolution of 2.44 Hz and filtering and preserve the details in CSI amplitude changes. time resolution of 12.8 ms to trace the changes in walking signals.Figure 3 shows an example spectrogram in a heat Figure 2(c)shows the second PCA component derived from the raw CSI streams in Figure 2(a).We observe that there map,where hotter color represents higher FFT amplitude.To are 17 peaks for the 0.5 second between 10~10.5 seconds build the heat map for the spectrogram,we use the first 80 in Figure 2(c).This gives 34 cycles/sec fluctuations in CSI. FFT magnitude of each chunk to represent the energy in the matching the walk speed of 1m/s of the human subject. frequency range of 0~146 Hz Spectrogram Enhancement Spectrogram Generation After a spectrogram is generated,we apply spectrogram en- It is still difficult to extract human gait information from a hancement techniques to further reduce the noise in the spec- PCA denoised CSI waveform because the signal reflections trogram. First,we get the energy level for each chunk by of different body parts are mixed together in the waveform. summing the magnitude of the first 80 FFT points.We Different human body parts move at different speeds during ignore chunks with energy level lower than an empirical different phases in walking.A gait cycle of human walking threshold so that silent periods are removed.We normalize has two phases:the stance phase and the swing phase [33]. the FFT magnitudes for each remaining chunk by dividing The stance phase starts at the time that the right heel touches them with the energy level of the chunk.Second,we ap- the ground.During the stance phase,the left leg moves for- ply frequency domain denoising method by subtracting the ward.At the end of the stance phase.the right toe leaves the noise floor from the spectrogram [7].The noise floor level is ground.In the swing phase,the human body is supported by estimated through a long-term mean over the spectrograms, the left leg and the right leg is swinging forward.Thus,the e.g.,average magnitude over 4 seconds.If the resulting mag- right leg moves at a higher speed than the torso and the left leg nitude becomes negative after subtraction,we set it to zero. is almost static during this phase [27].As different body parts Third,we superimpose the spectrograms generated by the move at different speeds,the radio signal reflections of differ- first twenty PCA results by adding up the magnitude of cor- ent body parts have different frequencies.CSI frequency is responding time-frequency blocks.Fourth,we apply a 2- determined by human moving speeds as f=2v/A,where v dimensional Gaussian low-pass filter,with a size of 5 and is the moving speed,f is the frequency of the CSI waveform, o of 0.8,on the resulting spectrogram.Finally,we obtain and A is the radio signal wavelength.For example,a moving a high quality spectrogram that gives detailed information for speed of 1 m/s can be converted to the frequency of 34.54 Hz the walking process of a human subject. when the radio wavelength A is 5.79cm. FEATURE EXTRACTION As the radio signal reflections of different body parts have dif- In this section,we present how gait features can be extracted ferent frequencies,the CSI fluctuations of different frequen- from the CSI spectrogram.The gait features include walking cies are separable in the frequency domain.Thus,to separate speed,gait cycle time,footstep length,movement speeds of the radio signal reflections of different body parts of different torso and legs,and spectrogram signatures.10 10.1 10.2 10.3 10.4 10.5 10.6 10.7 35 40 45 50 55 Time (seconds) CSI amplitude Impulse noises (a) Raw CSI waveforms (Stream A) 10 10.1 10.2 10.3 10.4 10.5 10.6 10.7 25 30 35 40 45 50 55 Time (seconds) CSI amplitude Stream A Stream B Residual noises (b) CSI waveforms after low-pass filtering 10 10.1 10.2 10.3 10.4 10.5 10.6 10.7 −30 −20 −10 0 10 20 30 Time (seconds) PCA amplitude (c) CSI waveforms after PCA denoising Figure 2. CSI waveforms for a person walking along a straight path as in Figure 1(b) and thus their radio wavelengths also differ. The phases of these CSI streams can differ by π and their waveforms may even cancel each other. Therefore, directly adding these CSI streams is also not a good choice for noise removal. We use Principal Component Analysis (PCA) based denoising algorithm to remove noises in the CSI signal [31]. Phase differences in CSI streams can be characterized by their cross correlations. PCA can automatically discover the correlation between CSI streams and recombine CSI streams to extract components that represent the variation caused by human activity. To remove the noise, we extract the first twenty PCA components from the 180 CSI streams and discard the rest, which are mostly noisy components. The optimal number of PCA components is determined by experiments shown in the experimental results section. The PCA denoised CSI waveforms are much smoother than those generated by low-pass filtering and preserve the details in CSI amplitude changes. Figure 2(c) shows the second PCA component derived from the raw CSI streams in Figure 2(a). We observe that there are 17 peaks for the 0.5 second between 10∼10.5 seconds in Figure 2(c). This gives 34 cycles/sec fluctuations in CSI, matching the walk speed of 1m/s of the human subject. Spectrogram Generation It is still difficult to extract human gait information from a PCA denoised CSI waveform because the signal reflections of different body parts are mixed together in the waveform. Different human body parts move at different speeds during different phases in walking. A gait cycle of human walking has two phases: the stance phase and the swing phase [33]. The stance phase starts at the time that the right heel touches the ground. During the stance phase, the left leg moves forward. At the end of the stance phase, the right toe leaves the ground. In the swing phase, the human body is supported by the left leg and the right leg is swinging forward. Thus, the right leg moves at a higher speed than the torso and the left leg is almost static during this phase [27]. As different body parts move at different speeds, the radio signal reflections of different body parts have different frequencies. CSI frequency is determined by human moving speeds as f = 2v/λ, where v is the moving speed, f is the frequency of the CSI waveform, and λ is the radio signal wavelength. For example, a moving speed of 1 m/s can be converted to the frequency of 34.54 Hz when the radio wavelength λ is 5.79cm. As the radio signal reflections of different body parts have different frequencies, the CSI fluctuations of different frequencies are separable in the frequency domain. Thus, to separate the radio signal reflections of different body parts of different moving speeds, we convert the PCA denoised CSI waveforms into the time-frequency domain. We use the Short-Time Fourier Transform (STFT) technique to transform the waveforms to spectrograms so that CSI waveforms can be analyzed in the time-frequency domain. The spectrogram uses a sliding window to cut a small piece of samples from the waveform and then performs Fast Fourier transform (FFT) on the waveform. The spectrogram has three dimensions: time, frequency, and FFT amplitude. The window size for FFT determines the tradeoffs between frequency and time resolution of STFT. With a larger window size, the STFT has higher frequency resolution but lower time resolutions. CSI measurements for human walking have frequency of 30∼40 Hz and changes in tens of milliseconds. Thus, we choose to use an FFT size of 1024 samples and sliding window step size of 32 samples because it gives suitable frequency resolution of 2.44 Hz and time resolution of 12.8 ms to trace the changes in walking signals. Figure 3 shows an example spectrogram in a heat map, where hotter color represents higher FFT amplitude. To build the heat map for the spectrogram, we use the first 80 FFT magnitude of each chunk to represent the energy in the frequency range of 0∼146 Hz. Spectrogram Enhancement After a spectrogram is generated, we apply spectrogram enhancement techniques to further reduce the noise in the spectrogram. First, we get the energy level for each chunk by summing the magnitude of the first 80 FFT points. We ignore chunks with energy level lower than an empirical threshold so that silent periods are removed. We normalize the FFT magnitudes for each remaining chunk by dividing them with the energy level of the chunk. Second, we apply frequency domain denoising method by subtracting the noise floor from the spectrogram [7]. The noise floor level is estimated through a long-term mean over the spectrograms, e.g., average magnitude over 4 seconds. If the resulting magnitude becomes negative after subtraction, we set it to zero. Third, we superimpose the spectrograms generated by the first twenty PCA results by adding up the magnitude of corresponding time-frequency blocks. Fourth, we apply a 2- dimensional Gaussian low-pass filter, with a size of 5 and σ of 0.8, on the resulting spectrogram. Finally, we obtain a high quality spectrogram that gives detailed information for the walking process of a human subject. FEATURE EXTRACTION In this section, we present how gait features can be extracted from the CSI spectrogram. The gait features include walking speed, gait cycle time, footstep length, movement speeds of torso and legs, and spectrogram signatures