正在加载图片...

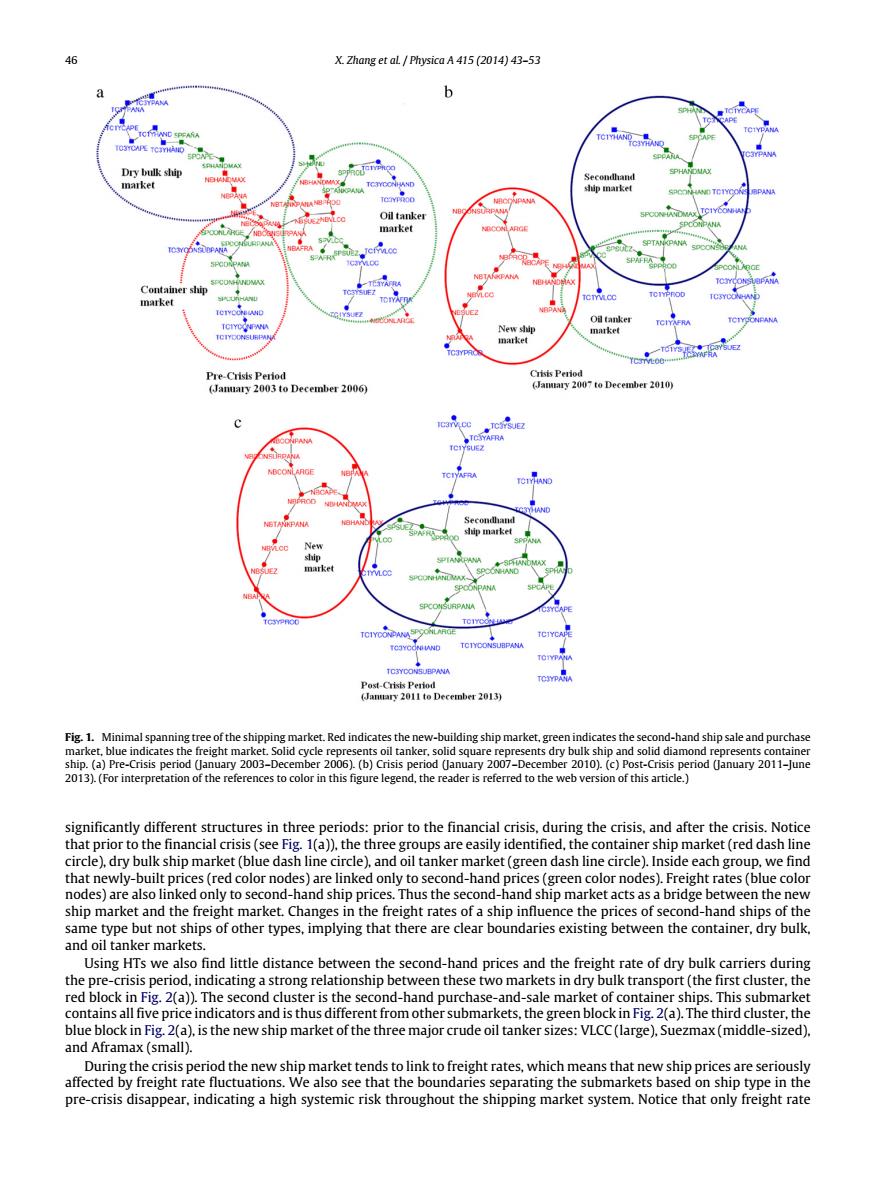
X.Zhang et aL Physica A 415 (2014)43-53 b ID EPFASA Dry bulk ship Secondhand market 4 ship market Oil tanker SPCONPANA market SPTANKPANA Container ship marker Oil tanker 开A New ship market marke Pre-Crisis Period Crisis Period (January 2003 to December 2006) (January 2007 to December 2010) UEZ NBCONLARGE FRA a Secondhaud shuip market New market .oc NPAN APE TCIYCONPANA TOTYPASA Post-Crisis Period (January 2011 to December 2013) Fig.1.Minimal spanning tree of the shipping market.Red indicates the new-building ship market,green indicates the second-hand ship sale and purchase market,blue indicates the freight market.Solid cycle represents oil tanker,solid square represents dry bulk ship and solid diamond represents container ship.(a)Pre-Crisis period (January 2003-December 2006).(b)Crisis period (January 2007-December 2010).(c)Post-Crisis period (January 2011-June 2013).(For interpretation of the references to color in this figure legend,the reader is referred to the web version of this article.) significantly different structures in three periods:prior to the financial crisis,during the crisis,and after the crisis.Notice that prior to the financial crisis(see Fig.1(a)),the three groups are easily identified,the container ship market(red dash line circle),dry bulk ship market(blue dash line circle),and oil tanker market(green dash line circle).Inside each group,we find that newly-built prices(red color nodes)are linked only to second-hand prices(green color nodes).Freight rates(blue color nodes)are also linked only to second-hand ship prices.Thus the second-hand ship market acts as a bridge between the new ship market and the freight market.Changes in the freight rates of a ship influence the prices of second-hand ships of the same type but not ships of other types,implying that there are clear boundaries existing between the container,dry bulk. and oil tanker markets. Using HTs we also find little distance between the second-hand prices and the freight rate of dry bulk carriers during the pre-crisis period,indicating a strong relationship between these two markets in dry bulk transport(the first cluster,the red block in Fig.2(a)).The second cluster is the second-hand purchase-and-sale market of container ships.This submarket contains all five price indicators and is thus different from other submarkets,the green block in Fig.2(a).The third cluster,the blue block in Fig.2(a),is the new ship market of the three major crude oil tanker sizes:VLCC(large),Suezmax(middle-sized). and Aframax(small). During the crisis period the new ship market tends to link to freight rates,which means that new ship prices are seriously affected by freight rate fluctuations.We also see that the boundaries separating the submarkets based on ship type in the pre-crisis disappear,indicating a high systemic risk throughout the shipping market system.Notice that only freight rate46 X. Zhang et al. / Physica A 415 (2014) 43–53 Fig. 1. Minimal spanning tree of the shipping market. Red indicates the new-building ship market, green indicates the second-hand ship sale and purchase market, blue indicates the freight market. Solid cycle represents oil tanker, solid square represents dry bulk ship and solid diamond represents container ship. (a) Pre-Crisis period (January 2003–December 2006). (b) Crisis period (January 2007–December 2010). (c) Post-Crisis period (January 2011–June 2013). (For interpretation of the references to color in this figure legend, the reader is referred to the web version of this article.) significantly different structures in three periods: prior to the financial crisis, during the crisis, and after the crisis. Notice that prior to the financial crisis (see Fig. 1(a)), the three groups are easily identified, the container ship market (red dash line circle), dry bulk ship market (blue dash line circle), and oil tanker market (green dash line circle). Inside each group, we find that newly-built prices (red color nodes) are linked only to second-hand prices (green color nodes). Freight rates (blue color nodes) are also linked only to second-hand ship prices. Thus the second-hand ship market acts as a bridge between the new ship market and the freight market. Changes in the freight rates of a ship influence the prices of second-hand ships of the same type but not ships of other types, implying that there are clear boundaries existing between the container, dry bulk, and oil tanker markets. Using HTs we also find little distance between the second-hand prices and the freight rate of dry bulk carriers during the pre-crisis period, indicating a strong relationship between these two markets in dry bulk transport (the first cluster, the red block in Fig. 2(a)). The second cluster is the second-hand purchase-and-sale market of container ships. This submarket contains all five price indicators and is thus different from other submarkets, the green block in Fig. 2(a). The third cluster, the blue block in Fig. 2(a), is the new ship market of the three major crude oil tanker sizes: VLCC (large), Suezmax (middle-sized), and Aframax (small). During the crisis period the new ship market tends to link to freight rates, which means that new ship prices are seriously affected by freight rate fluctuations. We also see that the boundaries separating the submarkets based on ship type in the pre-crisis disappear, indicating a high systemic risk throughout the shipping market system. Notice that only freight rate