正在加载图片...

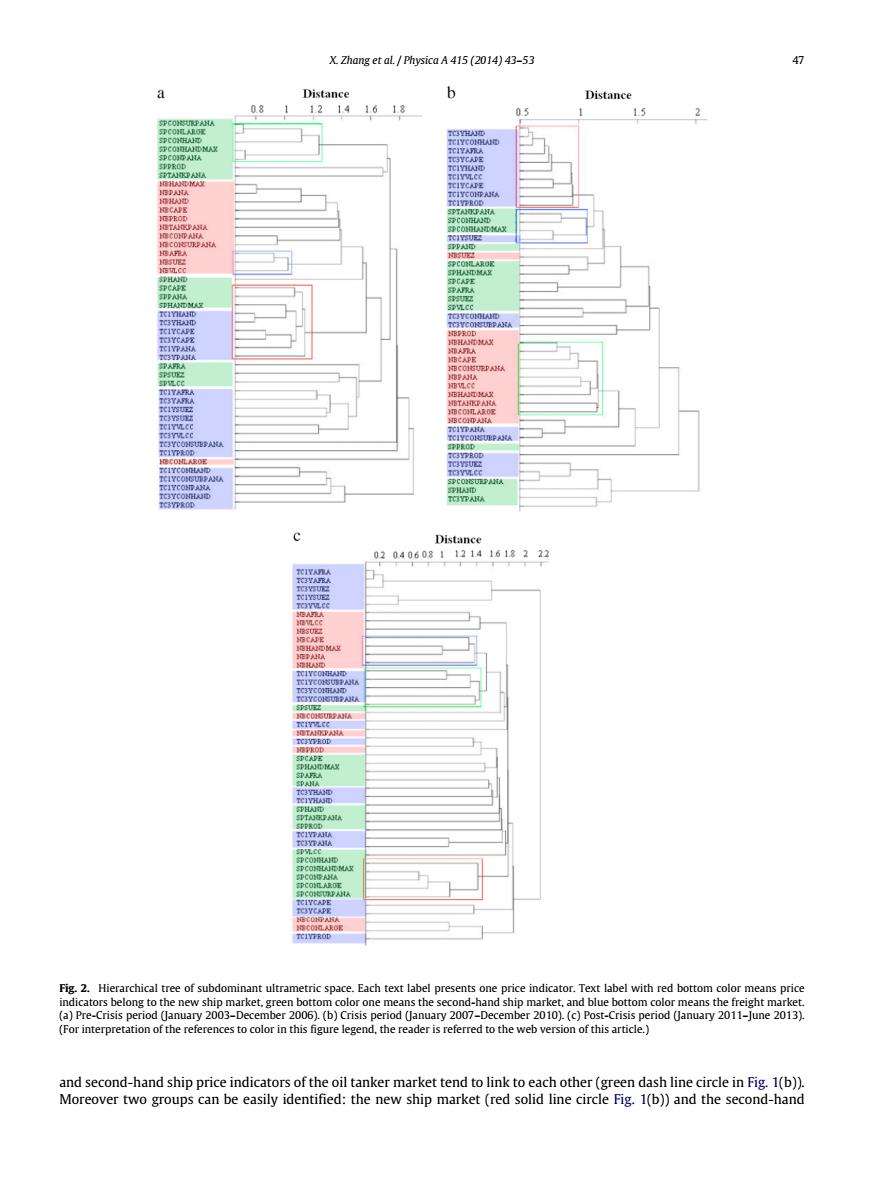
X.Zhang et al.Physica A 415 (2014)43-53 罗 Distance b Distance 0.8 12141.618 05 15 2 C0LA0 p00 字COs小A SPHAND TCYPAR Distance 02040608112141618222 11 APA3A Fig.2.Hierarchical tree of subdominant ultrametric space.Each text label presents one price indicator.Text label with red bottom color means price indicators belong to the new ship market,green bottom color one means the second-hand ship market,and blue bottom color means the freight market (a)Pre-Crisis period (January 2003-December 2006).(b)Crisis period (January 2007-December 2010).(c)Post-Crisis period (January 2011-June 2013). (For interpretation of the references to color in this figure legend,the reader is referred to the web version of this article.) and second-hand ship price indicators of the oil tanker market tend to link to each other(green dash line circle in Fig.1(b)). Moreover two groups can be easily identified:the new ship market (red solid line circle Fig.1(b))and the second-handX. Zhang et al. / Physica A 415 (2014) 43–53 47 Fig. 2. Hierarchical tree of subdominant ultrametric space. Each text label presents one price indicator. Text label with red bottom color means price indicators belong to the new ship market, green bottom color one means the second-hand ship market, and blue bottom color means the freight market. (a) Pre-Crisis period (January 2003–December 2006). (b) Crisis period (January 2007–December 2010). (c) Post-Crisis period (January 2011–June 2013). (For interpretation of the references to color in this figure legend, the reader is referred to the web version of this article.) and second-hand ship price indicators of the oil tanker market tend to link to each other (green dash line circle in Fig. 1(b)). Moreover two groups can be easily identified: the new ship market (red solid line circle Fig. 1(b)) and the second-hand