正在加载图片...
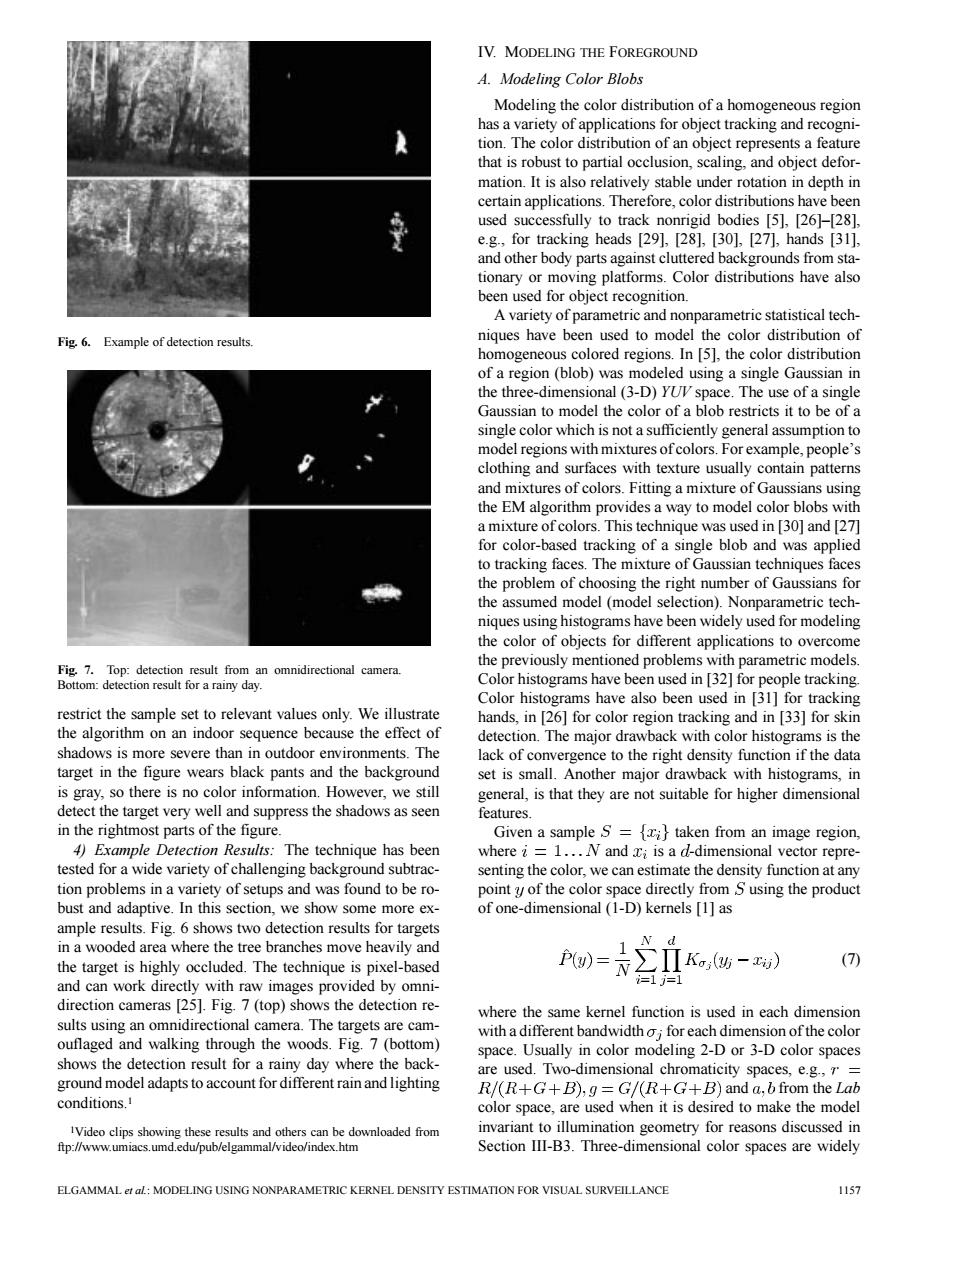
IV.MODELING THE FOREGROUND A.Modeling Color Blobs Modeling the color distribution of a homogeneous region has a variety of applications for object tracking and recogni- tion.The color distribution of an object represents a feature that is robust to partial occlusion,scaling,and object defor- mation.It is also relatively stable under rotation in depth in certain applications.Therefore,color distributions have been used successfully to track nonrigid bodies [5],[26]-[28], e.g.,for tracking heads [29],[28],[30],[27],hands [31]. and other body parts against cluttered backgrounds from sta- tionary or moving platforms.Color distributions have also been used for object recognition. A variety of parametric and nonparametric statistical tech- Fig.6.Example of detection results. niques have been used to model the color distribution of homogeneous colored regions.In [5],the color distribution of a region(blob)was modeled using a single Gaussian in the three-dimensional(3-D)YUI space.The use of a single Gaussian to model the color of a blob restricts it to be of a single color which is not a sufficiently general assumption to model regions with mixtures of colors.For example,people's clothing and surfaces with texture usually contain patterns and mixtures of colors.Fitting a mixture of Gaussians using the EM algorithm provides a way to model color blobs with a mixture of colors.This technique was used in [30]and [27] for color-based tracking of a single blob and was applied to tracking faces.The mixture of Gaussian techniques faces the problem of choosing the right number of Gaussians for the assumed model (model selection).Nonparametric tech- niques using histograms have been widely used for modeling the color of objects for different applications to overcome the previously mentioned problems with parametric models. Fig.7.Top:detection result from an omnidirectional camera. Bottom:detection result for a rainy day. Color histograms have been used in [32]for people tracking. Color histograms have also been used in [31]for tracking restrict the sample set to relevant values only.We illustrate hands,in [26]for color region tracking and in [33]for skin the algorithm on an indoor sequence because the effect of detection.The major drawback with color histograms is the shadows is more severe than in outdoor environments.The lack of convergence to the right density function if the data target in the figure wears black pants and the background set is small.Another major drawback with histograms,in is gray,so there is no color information.However,we still general,is that they are not suitable for higher dimensional detect the target very well and suppress the shadows as seen features. in the rightmost parts of the figure. Given a sample S={i}taken from an image region, 4)Example Detection Results:The technique has been where i=1...N and i is a d-dimensional vector repre- tested for a wide variety of challenging background subtrac- senting the color,we can estimate the density function at any tion problems in a variety of setups and was found to be ro- point y of the color space directly from S using the product bust and adaptive.In this section,we show some more ex- of one-dimensional(1-D)kernels [1]as ample results.Fig.6 shows two detection results for targets in a wooded area where the tree branches move heavily and the target is highly occluded.The technique is pixel-based (7) and can work directly with raw images provided by omni- direction cameras [25].Fig.7(top)shows the detection re- where the same kernel function is used in each dimension sults using an omnidirectional camera.The targets are cam- with a different bandwidtho;for each dimension of the color ouflaged and walking through the woods.Fig.7 (bottom) space.Usually in color modeling 2-D or 3-D color spaces shows the detection result for a rainy day where the back- are used.Two-dimensional chromaticity spaces,e.g.,= ground model adapts to account for different rain and lighting R/(R+G+B),g=G/(R+G+B)and a,b from the Lab conditions. color space,are used when it is desired to make the model IVideo clips showing these results and others can be downloaded from invariant to illumination geometry for reasons discussed in ftp://www.umiacs.umd.edu/pub/elgammal/video/index.htm Section III-B3.Three-dimensional color spaces are widely ELGAMMAL et al:MODELING USING NONPARAMETRIC KERNEL DENSITY ESTIMATION FOR VISUAL SURVEILLANCE 1157Fig. 6. Example of detection results. Fig. 7. Top: detection result from an omnidirectional camera. Bottom: detection result for a rainy day. restrict the sample set to relevant values only. We illustrate the algorithm on an indoor sequence because the effect of shadows is more severe than in outdoor environments. The target in the figure wears black pants and the background is gray, so there is no color information. However, we still detect the target very well and suppress the shadows as seen in the rightmost parts of the figure. 4) Example Detection Results: The technique has been tested for a wide variety of challenging background subtraction problems in a variety of setups and was found to be robust and adaptive. In this section, we show some more example results. Fig. 6 shows two detection results for targets in a wooded area where the tree branches move heavily and the target is highly occluded. The technique is pixel-based and can work directly with raw images provided by omnidirection cameras [25]. Fig. 7 (top) shows the detection results using an omnidirectional camera. The targets are camouflaged and walking through the woods. Fig. 7 (bottom) shows the detection result for a rainy day where the background model adapts to account for different rain and lighting conditions.1 1Video clips showing these results and others can be downloaded from ftp://www.umiacs.umd.edu/pub/elgammal/video/index.htm IV. MODELING THE FOREGROUND A. Modeling Color Blobs Modeling the color distribution of a homogeneous region has a variety of applications for object tracking and recognition. The color distribution of an object represents a feature that is robust to partial occlusion, scaling, and object deformation. It is also relatively stable under rotation in depth in certain applications. Therefore, color distributions have been used successfully to track nonrigid bodies [5], [26]–[28], e.g., for tracking heads [29], [28], [30], [27], hands [31], and other body parts against cluttered backgrounds from stationary or moving platforms. Color distributions have also been used for object recognition. A variety of parametric and nonparametric statistical techniques have been used to model the color distribution of homogeneous colored regions. In [5], the color distribution of a region (blob) was modeled using a single Gaussian in the three-dimensional (3-D) YUV space. The use of a single Gaussian to model the color of a blob restricts it to be of a single color which is not a sufficiently general assumption to model regions with mixtures of colors. For example, people’s clothing and surfaces with texture usually contain patterns and mixtures of colors. Fitting a mixture of Gaussians using the EM algorithm provides a way to model color blobs with a mixture of colors. This technique was used in [30] and [27] for color-based tracking of a single blob and was applied to tracking faces. The mixture of Gaussian techniques faces the problem of choosing the right number of Gaussians for the assumed model (model selection). Nonparametric techniques using histograms have been widely used for modeling the color of objects for different applications to overcome the previously mentioned problems with parametric models. Color histograms have been used in [32] for people tracking. Color histograms have also been used in [31] for tracking hands, in [26] for color region tracking and in [33] for skin detection. The major drawback with color histograms is the lack of convergence to the right density function if the data set is small. Another major drawback with histograms, in general, is that they are not suitable for higher dimensional features. Given a sample taken from an image region, where and is a -dimensional vector representing the color, we can estimate the density function at any point of the color space directly from using the product of one-dimensional (1-D) kernels [1] as (7) where the same kernel function is used in each dimension with a different bandwidth for each dimension of the color space. Usually in color modeling 2-D or 3-D color spaces are used. Two-dimensional chromaticity spaces, e.g., and from the Lab color space, are used when it is desired to make the model invariant to illumination geometry for reasons discussed in Section III-B3. Three-dimensional color spaces are widely ELGAMMAL et al.: MODELING USING NONPARAMETRIC KERNEL DENSITY ESTIMATION FOR VISUAL SURVEILLANCE 1157