正在加载图片...
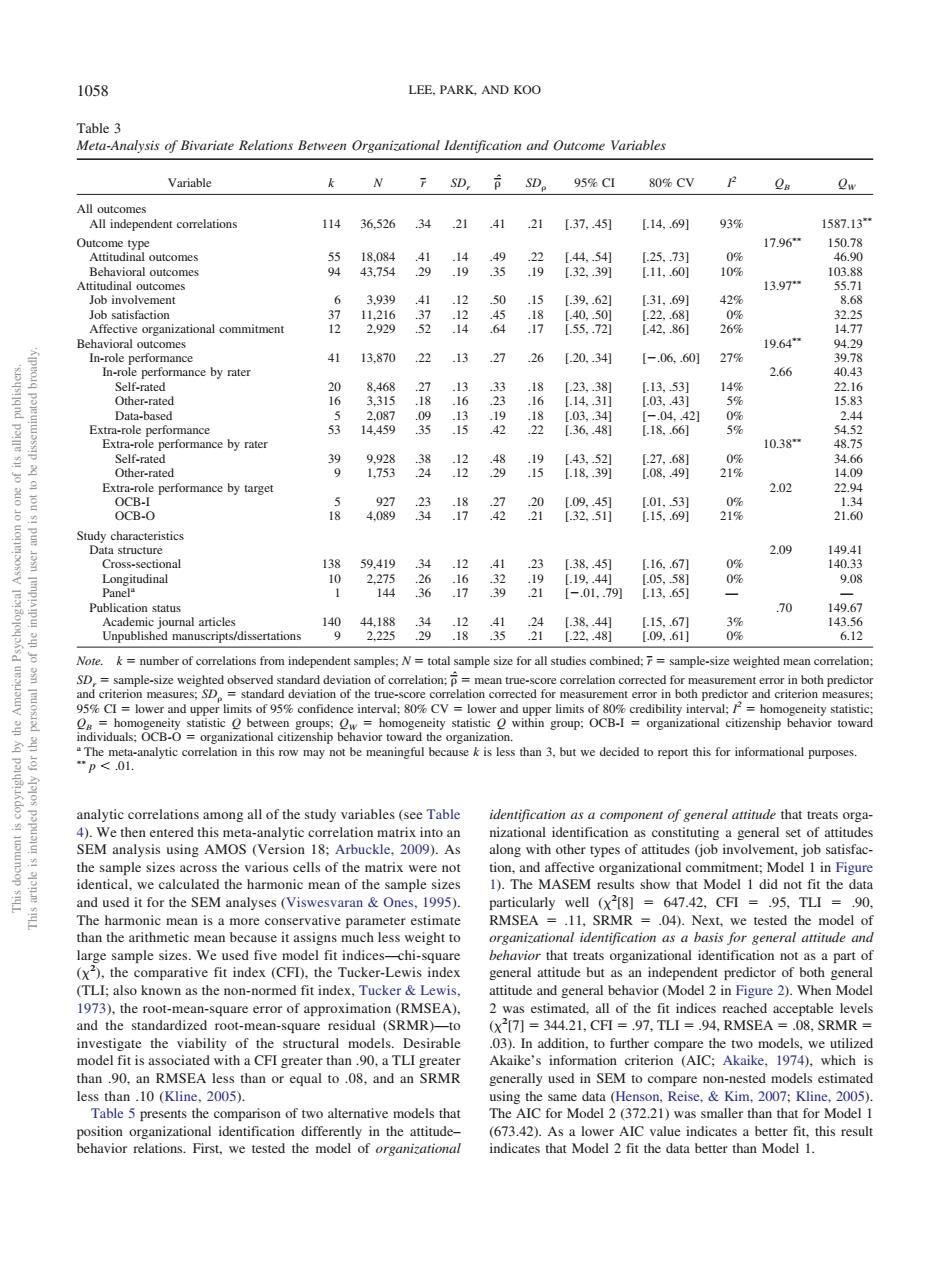
1058 LEE.PARK.AND KOO Variable kN7SD,方SD。95%C 80%CVPQ。 Q All outcon ndent correlation 1436.52634214121【37.4114.69193% 17.96 1587.1 oral ou 的出智治做监 13.97 tisfaction nalcommitment oral outcome 4113,87022132726【20.341[-.0660127% 19.64 e performance by rate 266 L18.66] 10.38- 9器”品88保刻傲绸 4 202 4胸器格名9路纷制 2.09 70 g站R4竖烟版 ations from independent samples:N=total sample size for all studies combined:=sample-size weiehted mean ower ithin group:OCB-Io lity in alytic com in this row may not be Is less 3.but we decided to repo this for informational purposes D<01 SEM tical,wecalculated the harmonic mean of the tion andecvo ults show that Model 1 did not fit the dat M analyses (Viswesvaran&Ones 995 .CF the arithn e it a uch less weight to al identification as a bas cker-Lewis inde TLI;also known as the non-normed fit index,Tucker&Lewis ttitude and general beh havior (Model 2 in Figure 2).When Mode han 90.an RMSEA less than or equal to .08.and an SRMR ally used in sem to com sted models estimated than1(Kline,2005 Reise,&Kim,2007 ison of tw ition ty in the attitude 673.42).As 2 fit the data analytic correlations among all of the study variables (see Table 4). We then entered this meta-analytic correlation matrix into an SEM analysis using AMOS (Version 18; Arbuckle, 2009). As the sample sizes across the various cells of the matrix were not identical, we calculated the harmonic mean of the sample sizes and used it for the SEM analyses (Viswesvaran & Ones, 1995). The harmonic mean is a more conservative parameter estimate than the arithmetic mean because it assigns much less weight to large sample sizes. We used five model fit indices—chi-square (2 ), the comparative fit index (CFI), the Tucker-Lewis index (TLI; also known as the non-normed fit index, Tucker & Lewis, 1973), the root-mean-square error of approximation (RMSEA), and the standardized root-mean-square residual (SRMR)—to investigate the viability of the structural models. Desirable model fit is associated with a CFI greater than .90, a TLI greater than .90, an RMSEA less than or equal to .08, and an SRMR less than .10 (Kline, 2005). Table 5 presents the comparison of two alternative models that position organizational identification differently in the attitude– behavior relations. First, we tested the model of organizational identification as a component of general attitude that treats organizational identification as constituting a general set of attitudes along with other types of attitudes (job involvement, job satisfaction, and affective organizational commitment; Model 1 in Figure 1). The MASEM results show that Model 1 did not fit the data particularly well (2 [8] 647.42, CFI .95, TLI .90, RMSEA .11, SRMR .04). Next, we tested the model of organizational identification as a basis for general attitude and behavior that treats organizational identification not as a part of general attitude but as an independent predictor of both general attitude and general behavior (Model 2 in Figure 2). When Model 2 was estimated, all of the fit indices reached acceptable levels (2 [7] 344.21, CFI .97, TLI .94, RMSEA .08, SRMR .03). In addition, to further compare the two models, we utilized Akaike’s information criterion (AIC; Akaike, 1974), which is generally used in SEM to compare non-nested models estimated using the same data (Henson, Reise, & Kim, 2007; Kline, 2005). The AIC for Model 2 (372.21) was smaller than that for Model 1 (673.42). As a lower AIC value indicates a better fit, this result indicates that Model 2 fit the data better than Model 1. Table 3 Meta-Analysis of Bivariate Relations Between Organizational Identification and Outcome Variables Variable kNr SDr ˆ SD 95% CI 80% CV I 2 QB QW All outcomes All independent correlations 114 36,526 .34 .21 .41 .21 [.37, .45] [.14, .69] 93% 1587.13 Outcome type 17.96 150.78 Attitudinal outcomes 55 18,084 .41 .14 .49 .22 [.44, .54] [.25, .73] 0% 46.90 Behavioral outcomes 94 43,754 .29 .19 .35 .19 [.32, .39] [.11, .60] 10% 103.88 Attitudinal outcomes 13.97 55.71 Job involvement 6 3,939 .41 .12 .50 .15 [.39, .62] [.31, .69] 42% 8.68 Job satisfaction 37 11,216 .37 .12 .45 .18 [.40, .50] [.22, .68] 0% 32.25 Affective organizational commitment 12 2,929 .52 .14 .64 .17 [.55, .72] [.42, .86] 26% 14.77 Behavioral outcomes 19.64 94.29 In-role performance 41 13,870 .22 .13 .27 .26 [.20, .34] [.06, .60] 27% 39.78 In-role performance by rater 2.66 40.43 Self-rated 20 8,468 .27 .13 .33 .18 [.23, .38] [.13, .53] 14% 22.16 Other-rated 16 3,315 .18 .16 .23 .16 [.14, .31] [.03, .43] 5% 15.83 Data-based 5 2,087 .09 .13 .19 .18 [.03, .34] [.04, .42] 0% 2.44 Extra-role performance 53 14,459 .35 .15 .42 .22 [.36, .48] [.18, .66] 5% 54.52 Extra-role performance by rater 10.38 48.75 Self-rated 39 9,928 .38 .12 .48 .19 [.43, .52] [.27, .68] 0% 34.66 Other-rated 9 1,753 .24 .12 .29 .15 [.18, .39] [.08, .49] 21% 14.09 Extra-role performance by target 2.02 22.94 OCB-I 5 927 .23 .18 .27 .20 [.09, .45] [.01, .53] 0% 1.34 OCB-O 18 4,089 .34 .17 .42 .21 [.32, .51] [.15, .69] 21% 21.60 Study characteristics Data structure 2.09 149.41 Cross-sectional 138 59,419 .34 .12 .41 .23 [.38, .45] [.16, .67] 0% 140.33 Longitudinal 10 2,275 .26 .16 .32 .19 [.19, .44] [.05, .58] 0% 9.08 Panela 1 144 .36 .17 .39 .21 [.01, .79] [.13, .65] — — Publication status .70 149.67 Academic journal articles 140 44,188 .34 .12 .41 .24 [.38, .44] [.15, .67] 3% 143.56 Unpublished manuscripts/dissertations 9 2,225 .29 .18 .35 .21 [.22, .48] [.09, .61] 0% 6.12 Note. k number of correlations from independent samples; N total sample size for all studies combined; r sample-size weighted mean correlation; SDr sample-size weighted observed standard deviation of correlation; ˆ mean true-score correlation corrected for measurement error in both predictor and criterion measures; SD standard deviation of the true-score correlation corrected for measurement error in both predictor and criterion measures; 95% CI lower and upper limits of 95% confidence interval; 80% CV lower and upper limits of 80% credibility interval; I 2 homogeneity statistic; QB homogeneity statistic Q between groups; QW homogeneity statistic Q within group; OCB-I organizational citizenship behavior toward individuals; OCB-O organizational citizenship behavior toward the organization. a The meta-analytic correlation in this row may not be meaningful because k is less than 3, but we decided to report this for informational purposes. p .01. This document is copyrighted by the American Psychological Association or one of its allied publishers. This article is intended solely for the personal use of the individual user and is not to be disseminated broadly. 1058 LEE, PARK, AND KOO�����������������������������������������