正在加载图片...

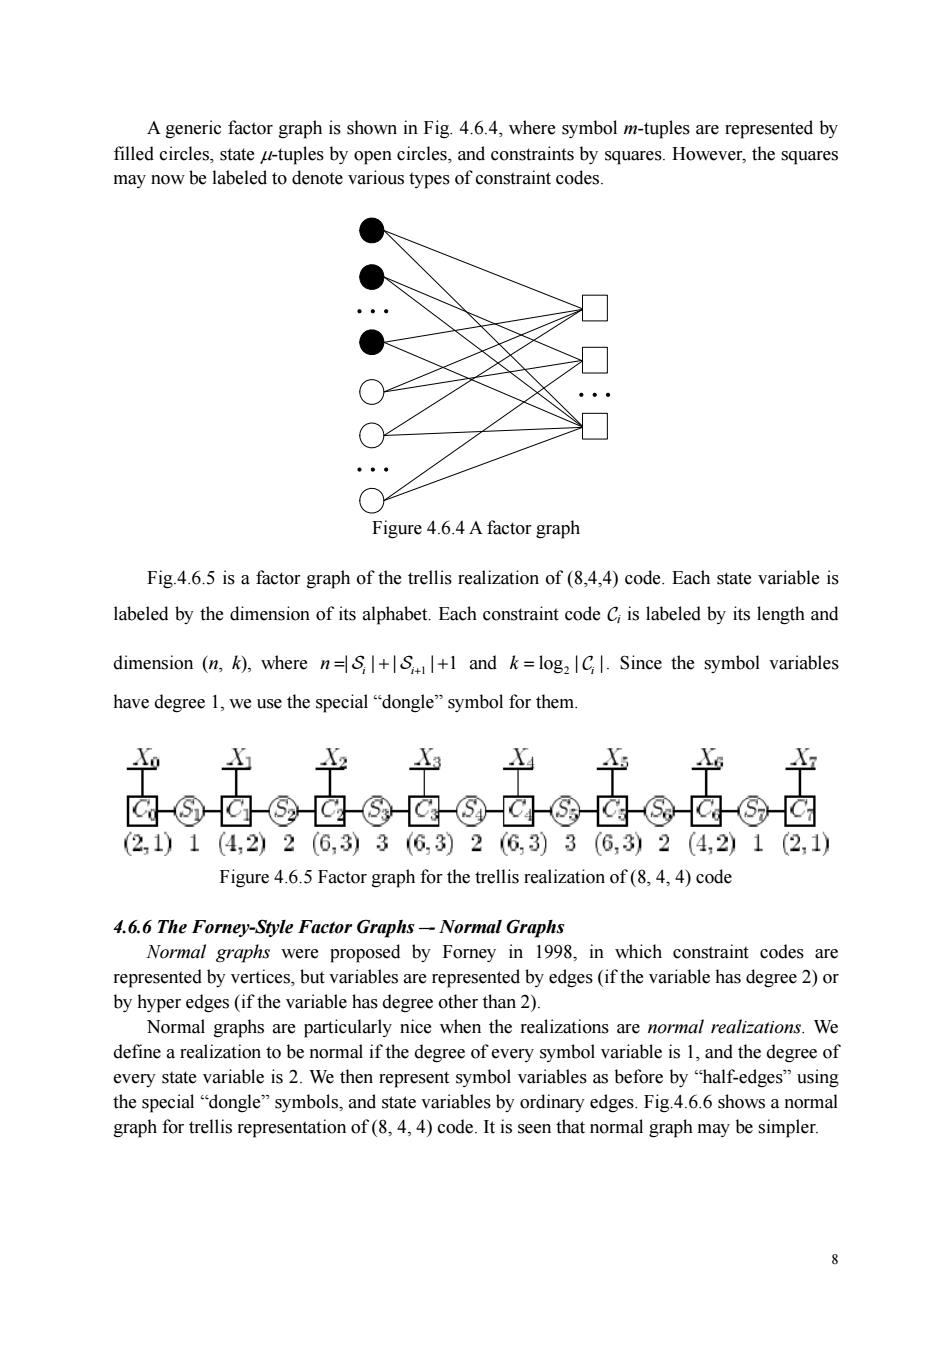
A generic factor graph is shown in Fig.4.6.4,where symbol m-tuples are represented by filled circles, ○ Figure 4.6.4 A factor graph Fig.4.6.5 is a factor graph of the trellis realization of (84,4)code.Each state variable is labeled by the dimension of its alphabet.Each constraint code C is labeled by its length and dimension (n,k),where n=+.+1 and k=log,C Since the symbol variables have degree 1,we use the special"dongle"symbol for them. 囟-③白-③应③区-③-应@囟-⑧应-③□ (2,1)1(4,2)2(6,3)3(G,3)26,3)3(6,3)2(4,2)1(2,1) Figure 4.6.5 Factor graph for the trellis realization of (8,4,4)code 4.6.6 The Forney-Style Factor Graphs-Normal Graphs Normal were proposed by Forney in 1998,in which co straint codes are represented by vertices,but variables are represented by edges(if the variable has degree 2)o by hyper edges(if the variable has degree other than 2). Normal graphs are particularly nice when the realizations are normal realizations.We define a realization to be normal if the degree of every symbol variable is 1,and the degree of every state variable W then represent symbol variables as before by hal-edgesn the ”symbols,.and by ordinary edges.Fig.6.6 shows an rcsnttion of ()de Ii seen that nommal r may be simpler8 A generic factor graph is shown in Fig. 4.6.4, where symbol m-tuples are represented by filled circles, state μ-tuples by open circles, and constraints by squares. However, the squares may now be labeled to denote various types of constraint codes. Figure 4.6.4 A factor graph Fig.4.6.5 is a factor graph of the trellis realization of (8,4,4) code. Each state variable is labeled by the dimension of its alphabet. Each constraint code Ci is labeled by its length and dimension (n, k), where 1 | | | |1 i i n =+ + S S + and 2 log | | i k = C . Since the symbol variables have degree 1, we use the special “dongle” symbol for them. Figure 4.6.5 Factor graph for the trellis realization of (8, 4, 4) code 4.6.6 The Forney-Style Factor Graphs –- Normal Graphs Normal graphs were proposed by Forney in 1998, in which constraint codes are represented by vertices, but variables are represented by edges (if the variable has degree 2) or by hyper edges (if the variable has degree other than 2). Normal graphs are particularly nice when the realizations are normal realizations. We define a realization to be normal if the degree of every symbol variable is 1, and the degree of every state variable is 2. We then represent symbol variables as before by “half-edges” using the special “dongle” symbols, and state variables by ordinary edges. Fig.4.6.6 shows a normal graph for trellis representation of (8, 4, 4) code. It is seen that normal graph may be simpler. . .