正在加载图片...
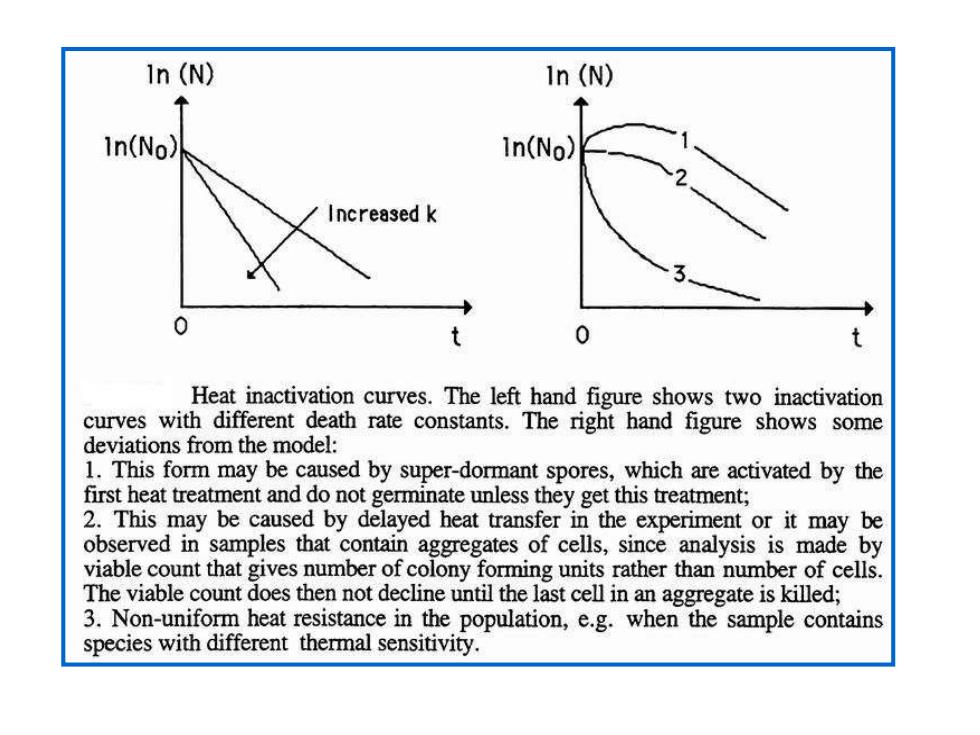
1n(N) 1n(N) In(No) In(No) Increased k 0 t 0 Heat inactivation curves.The left hand figure shows two inactivation curves with different death rate constants.The right hand figure shows some deviations from the model: 1.This form may be caused by super-dormant spores,which are activated by the first heat treatment and do not germinate unless they get this treatment; 2.This may be caused by delayed heat transfer in the experiment or it may be observed in samples that contain aggregates of cells,since analysis is made by viable count that gives number of colony forming units rather than number of cells. The viable count does then not decline until the last cell in an aggregate is killed; 3.Non-uniform heat resistance in the population,e.g.when the sample contains species with different thermal sensitivity