正在加载图片...
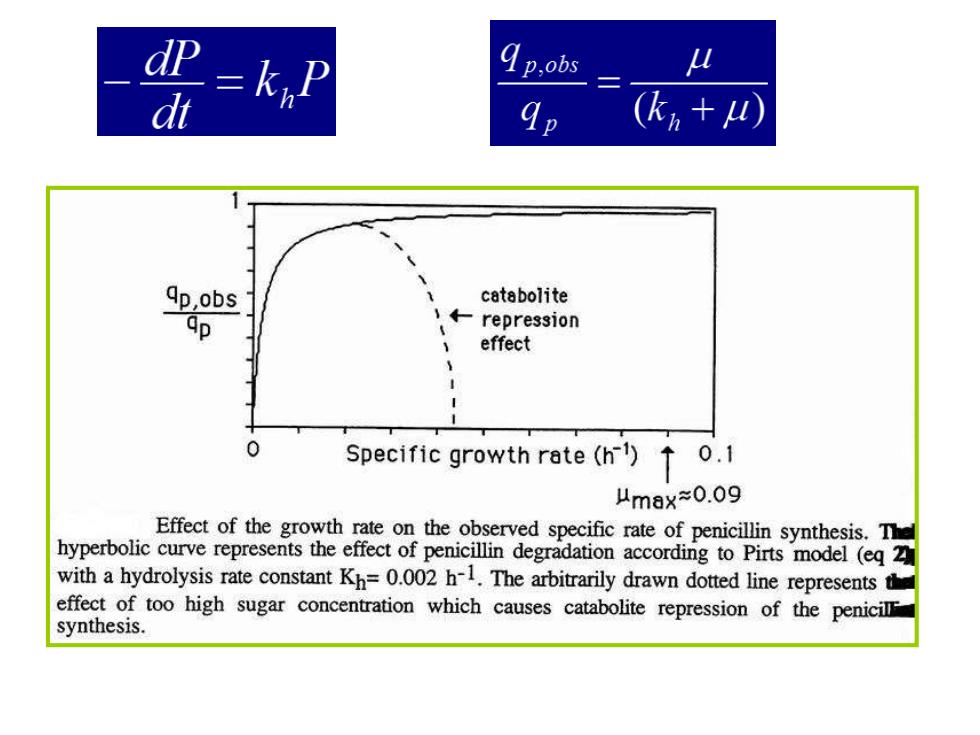
= 4p.obs 9p (k+ ap,obs catabolite ←repres3ion effect 1 0 Specific growth rate(h1)0.1 max≈0.09 Effect of the growth rate on the observed specific rate of penicillin synthesis.The hyperbolic curve represents the effect of penicillin degradation according to Pirts model (eq 2 with a hydrolysis rate constant Kh=0.002 h-1.The arbitrarily drawn dotted line representsh effect of too high sugar concentration which causes catabolite repression of the penicilF synthesis