
Chapter 12 Antibiotics
Chapter 12 Antibiotics

Some examples of classification of antibiotics Biochemical function: Inhibition of Example Nucleic acid synthesis Nalidixinic acid (DNA) Protein synthesis Streptomycin,Tetracycline,Chloramphenicol Cell wall synthesis Penicillin,Cephalosporin Membrane function Polymyxin Energy metabolism Gramicidin Structure: Class:Activity against Example B-lactams G+bacteria Penicillin,Cephalosporin Aminoglycosides G+&G-bacteria Streptomycin,Kanamycin Macrolides G+bacteria Erythromycin Polypeptides G+&G-bacteria Bacitracin,Polymyxin Kinons Broad-spectrum Tetracycline Polyenes Fungi Nystatin,Amphotericin Antimicrobial spectrum: Bactericide Kills bacteria Bacteristatic Inhibits bacteria Fungicide Kills fungi Fungistatic Inhibits fungi Antiviral Active against virus Broad-spectrum Active against many types of microorganisms
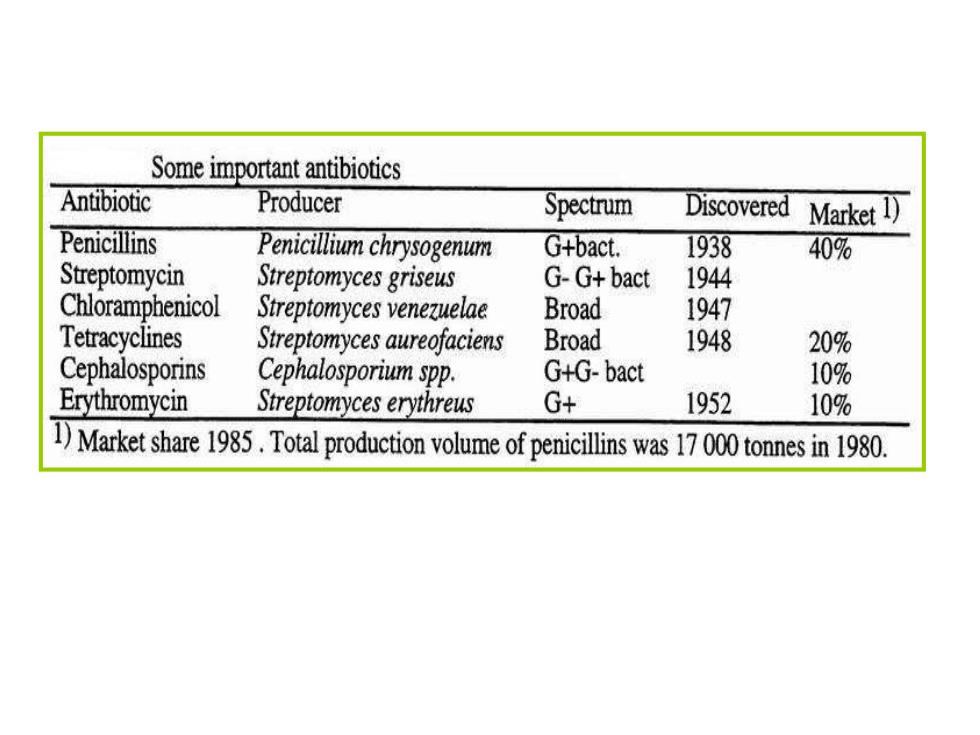
Some important antibiotics Antibiotic Producer Spectrum Discovered Market 1) Penicillins Penicillium chrysogenum G+bact. 1938 40% Streptomycin Streptomyces griseus G-G+bact 1944 Chloramphenicol Streptomyces venezuelae Broad 1947 Tetracyclines Streptomyces aureofaciens Broad 1948 20% Cephalosporins Cephalosporium spp. G+G-bact 10% Erythromycin Streptomyces erythreus G+ 1952 10% 1)Market share 195.Total production voume of penicillins was 17000tones in1980
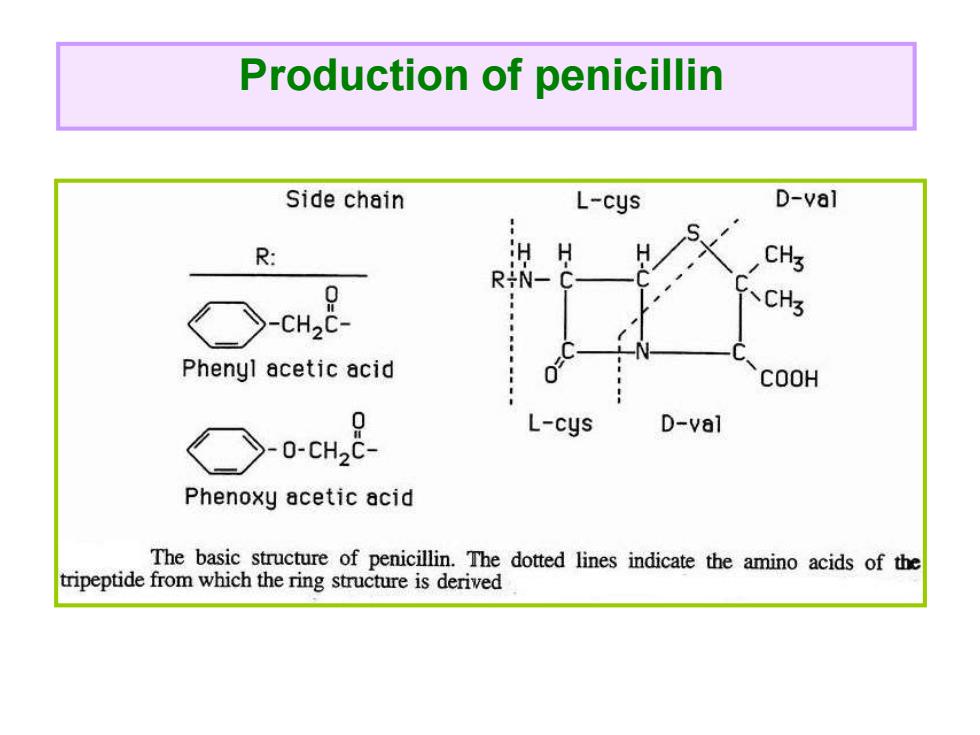
Production of penicillin Side chain L-cys D-val R: RiN- CHs -, 、CH Phenyl acetic acid COOH L-cys D-val Phenoxy acetic acid The basic structure of penicillin.The dotted lines indicate the amino acids of the tripeptide from which the ring structure is derived
Production of penicillin
Penicillin G:benzylpenicillin Penicillin V:phenoxymethypenicillin Strain: Penicillium notatum (1940s) Penicillium chrysogenum 6-APA
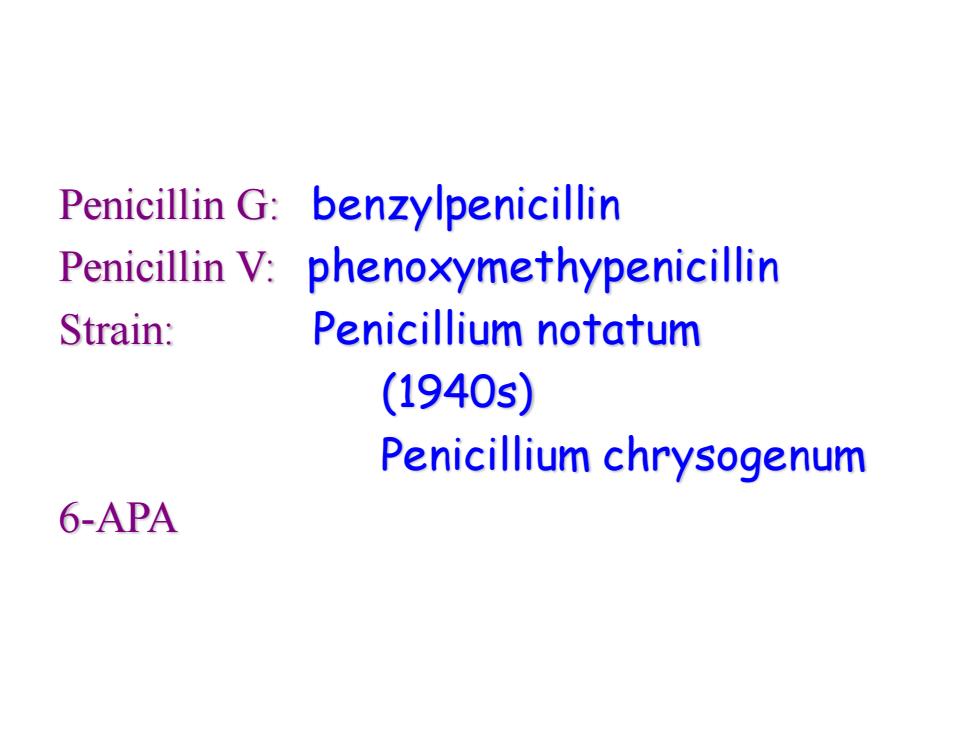
Penicillin G: benzylpenicillin Penicillin V: phenoxymethypenicillin Strain: Penicillium notatum (1940s) Penicillium chrysogenum 6-APA
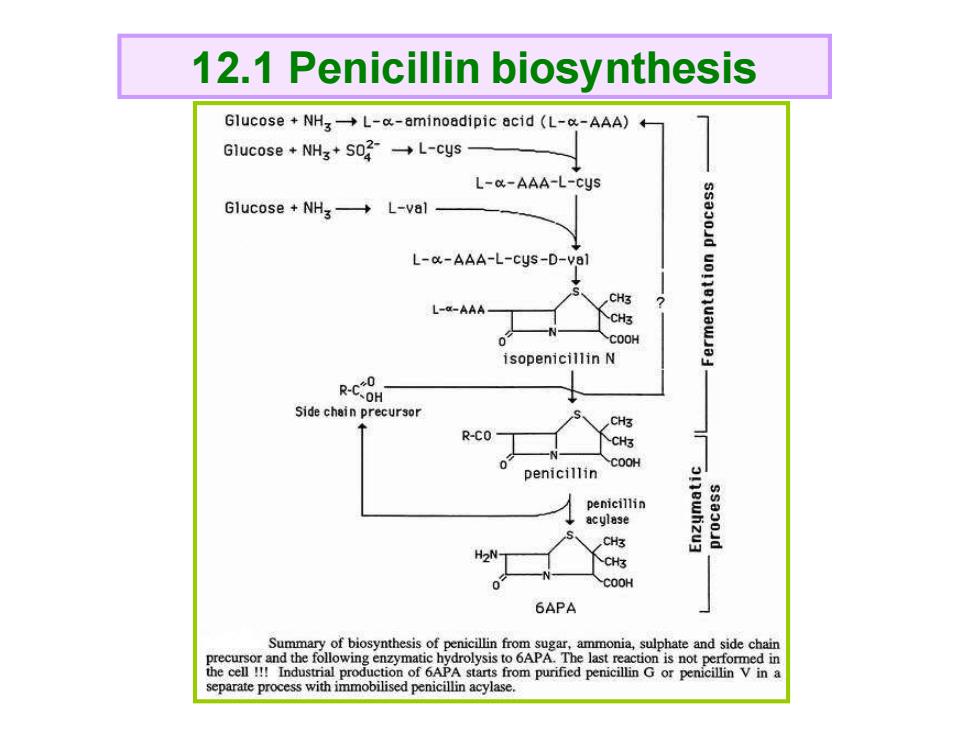
12.1 Penicillin biosynthesis Glucose NH-L-o-aminoadipic acid (L-a-AAA)+ Glucose NH3+S02--L-cys L-a-AAA-L-cys Glucose+NH3→L-Val L-a-AAA-L-cys-D-val CH3 L-a-AAA CH3 COOH isopenicillin N RCOH Side chein precursor R-CO CH3 COOH penicillin penicillin acylase CH3 H2 CH3 COOH 6APA 兰 Summary of biosynthesis of penicillin from ammoni,sulphate and side chain separate process with immobilised penicillin acylase
12.1 Penicillin biosynthesis
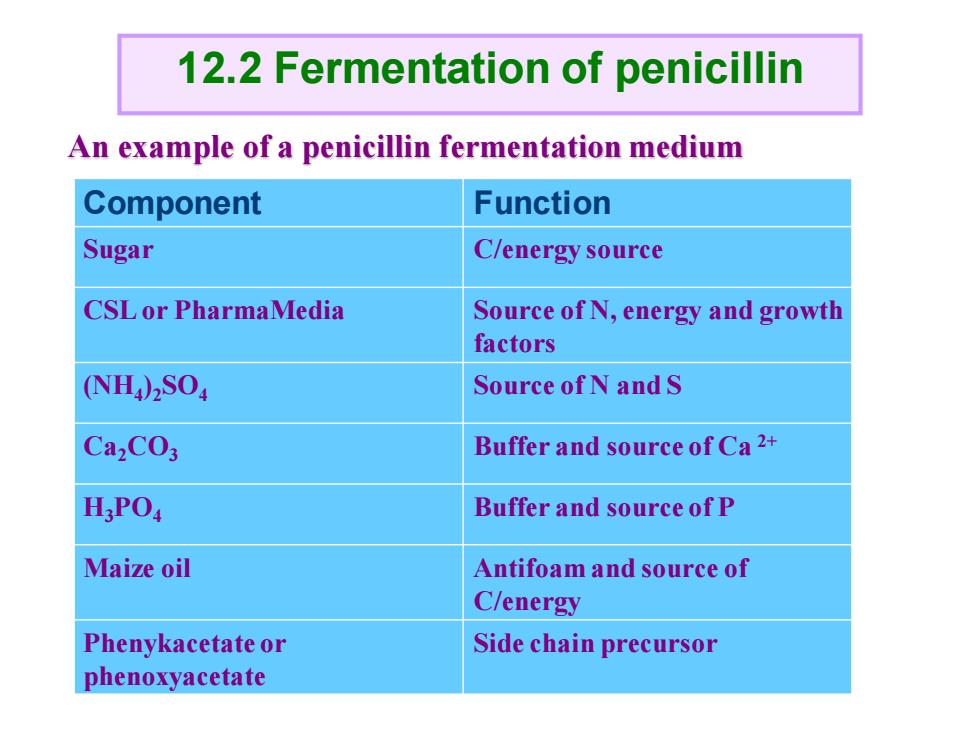
12.2 Fermentation of penicillin An example of a penicillin fermentation medium Component Function Sugar C/energy source CSL or PharmaMedia Source of N,energy and growth factors NH4)2S04 Source ofN and S Ca2CO3 Buffer and source of Ca2+ H;PO Buffer and source of P Maize oil Antifoam and source of C/energy Phenykacetate or Side chain precursor phenoxyacetate
An example of a penicillin fermentation medium Component Function Sugar C/energy source CSL or PharmaMedia Source of N, energy and growth factors (NH4 )2SO4 Source of N and S Ca2CO3 Buffer and source of Ca 2+ H3PO4 Buffer and source of P Maize oil Antifoam and source of C/energy Phenykacetate or phenoxyacetate Side chain precursor 12.2 Fermentation of penicillin

DOT PH DOT- s 24 48 72 96 120 Time(h) Schematic presentation of a penicillin production process.Initially,when sugar is available in excess,pH decreases because of production of organic acids.When the sugar concentration is exhausted after about 24 h most of the pH increase is attributed to the consumption of some of the organic acids of the medium,which gives a pH increase.When pH reaches a suitable value in the range 6-7 a continuous feed of sugar is started,which stabilises pH.Further pH control is achieved by titration.The onset of energy starvation initiates the penicillin production,which is first quite constant but eventually declines due to reduced specific production rate and increased penicillin degradation.DOT is a function of the sugar feed rate and the KL a,which is strongly dependent on the viscosity of the broth
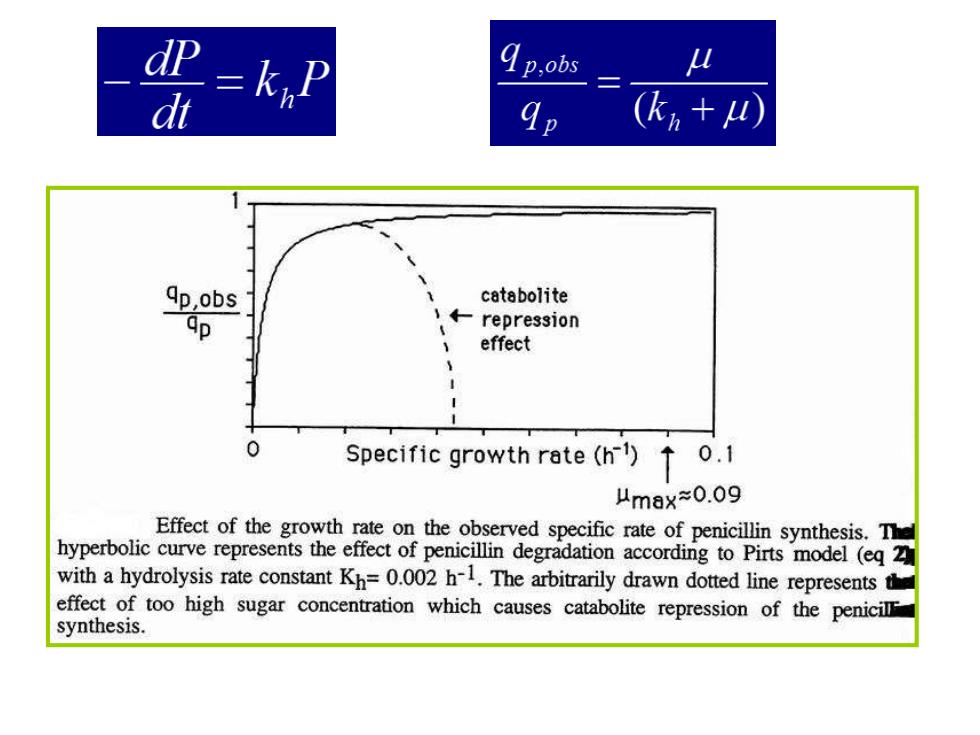
= 4p.obs 9p (k+ ap,obs catabolite ←repres3ion effect 1 0 Specific growth rate(h1)0.1 max≈0.09 Effect of the growth rate on the observed specific rate of penicillin synthesis.The hyperbolic curve represents the effect of penicillin degradation according to Pirts model (eq 2 with a hydrolysis rate constant Kh=0.002 h-1.The arbitrarily drawn dotted line representsh effect of too high sugar concentration which causes catabolite repression of the penicilF synthesis

会=--xg* em F()= V(t)X(t S (9m+y (silun que 40h 66h 0 10 2030405060 70 DOT air sat.) Effect of Pc chrysogenumn mycelium morphology on the Monod curve for oxygen.The high Ks value and the bi-phasic form of the older culture(66 h after spore inoculation)is caused by a high degree of pellets in the culture,while the young culture(40 h after spore inoculation) was growing mainly as diffuse mycelium,with low Ks-value