
CHAPTER 6 Modes of Process Operation
Chapter 6 Modes of Process Operation
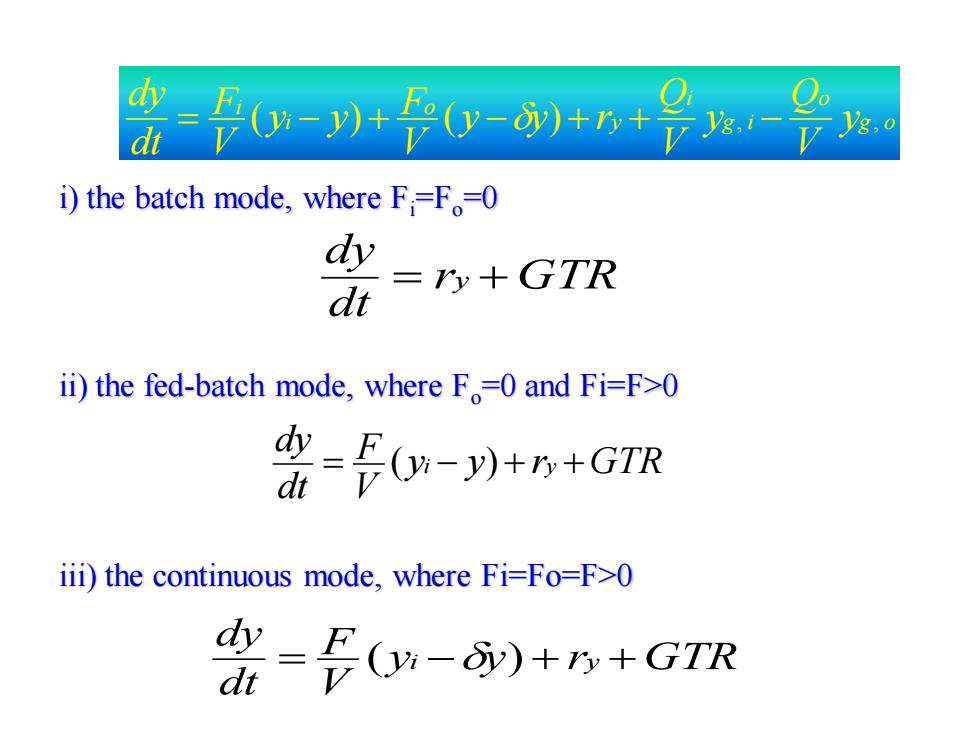
办=0-)+(0-)++i yg.o i)the batch mode,where F;=F=0 dy =r+GTR dt ii)the fed-batch mode,where F=0 and Fi=F>0 产-0-++GR iii)the continuous mode,where Fi=Fo=F>0 答=会0w-8)+5+G7R
i) the batch mode, where Fi=Fo=0 ii) the fed-batch mode, where Fo=0 and Fi=F>0 iii) the continuous mode, where Fi=Fo=F>0 g o o g i i y o i i y V Q y V Q y y r V F y y V F dt dy = ( − ) + ( − ) + + , − , r GTR dt dy = y + y y r GTR V F dt dy = ( i − ) + y + y y r GTR V F dt dy = ( i − ) + y +
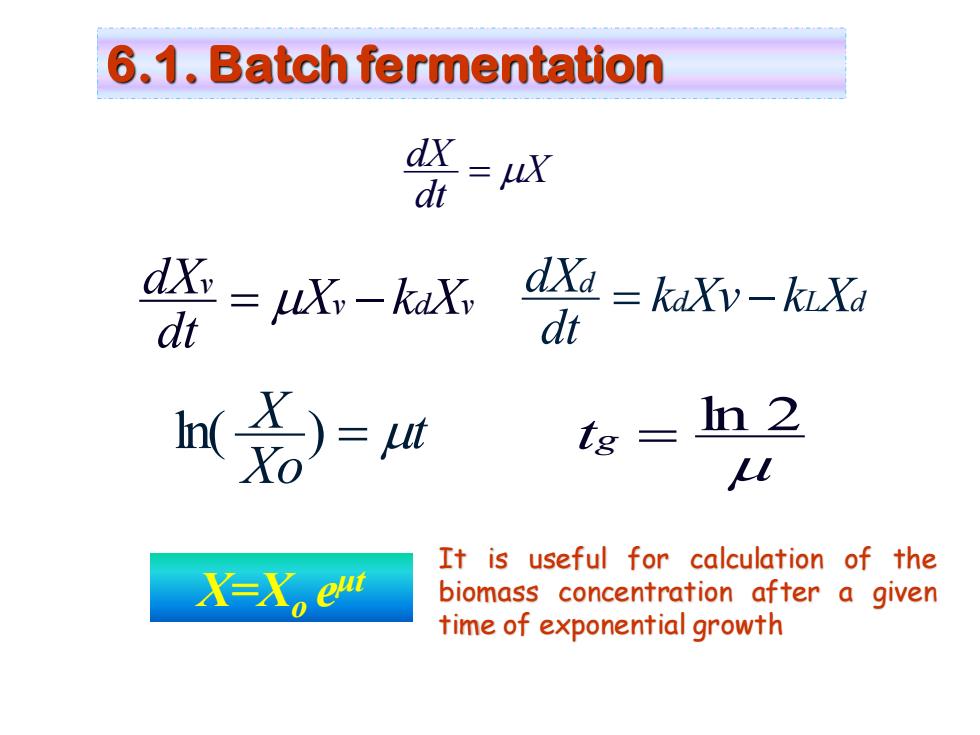
6.1.Batch fermentation =uX dt dX=jKy-kaXv dXd=kaXv-kiXa dt dt M名)=a tg= In 2 L It is useful for calculation of the X=Xoem biomass concentration after a given time of exponential growth
6.1. Batch fermentation X dt dX = v d v v X k X dt dX = − d L d d k Xv k X dt dX = − t Xo X ln( ) = ln 2 tg = X=Xo e μt It is useful for calculation of the biomass concentration after a given time of exponential growth
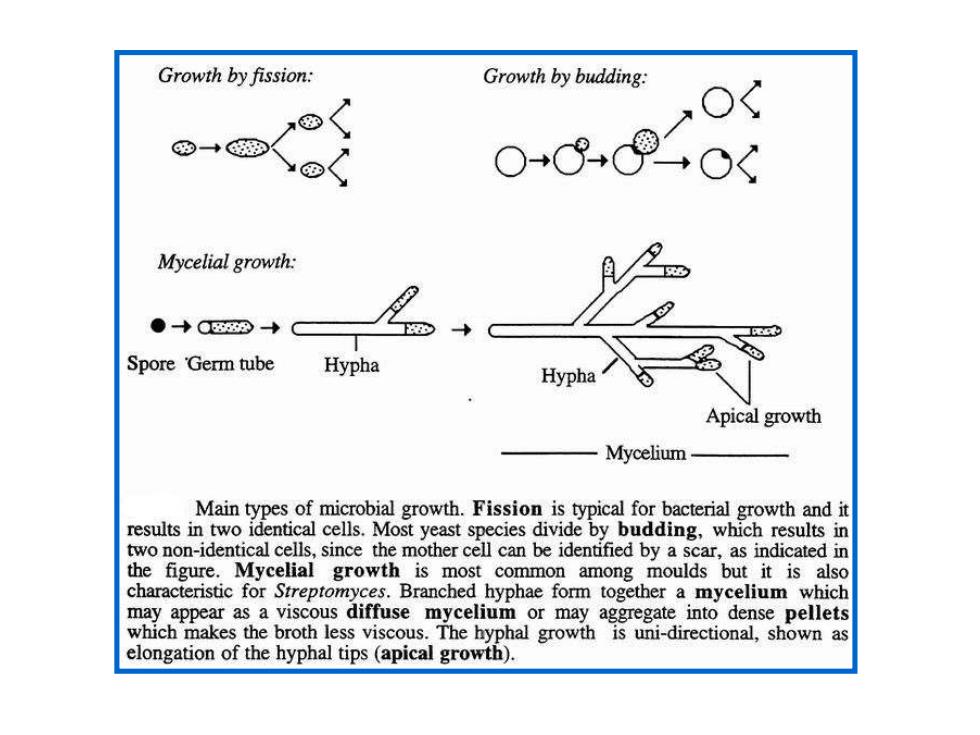
Growth by fission: Growth by budding: $+88 Mycelial growth: ●+Q8→ Spore Germ tube Hypha Hypha Apical growth Mycelium Main types of microbial growth.Fission is typical for bacterial growth and it results in two identical cells.Most yeast species divide by budding,which results in two non-identical cells,since the mother cell can be identified by a scar,as indicated in the figure.Mycelial growth is most common among moulds but it is also characteristic for Streptomyces.Branched hyphae form together a mycelium which may appear as a viscous diffuse mycelium or may aggregate into dense pellets which makes the broth less viscous.The hyphal growth is uni-directional,shown as elongation of the hyphal tips(apical growth)
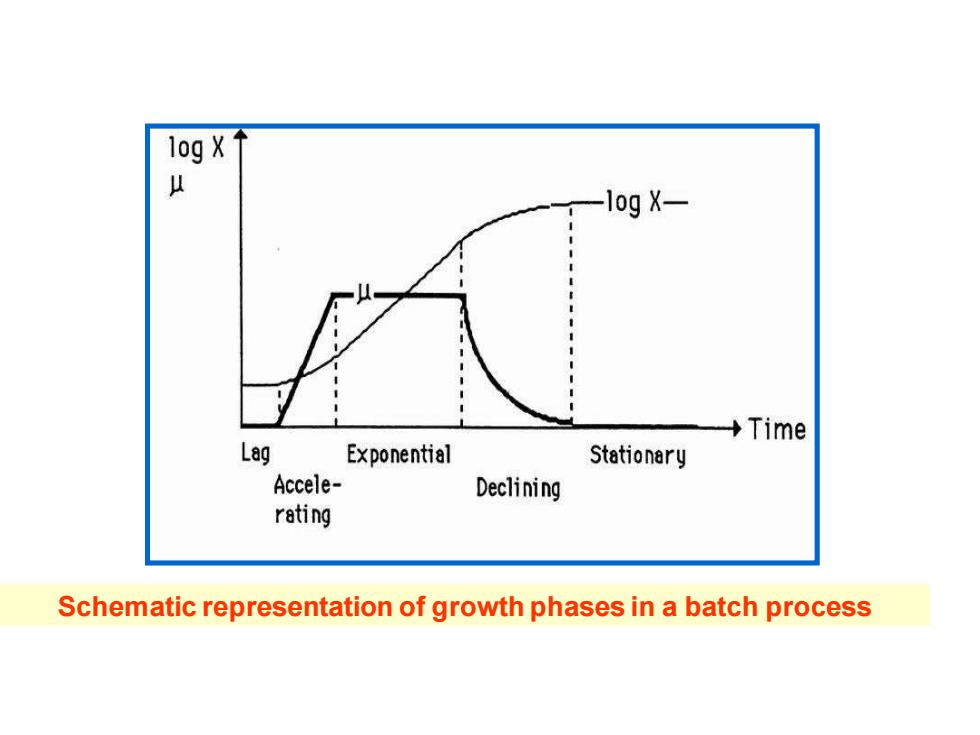
gx y -log X- +Time Lag Exponential Stationary Accele- Declining rating Schematic representation of growth phases in a batch process
Schematic representation of growth phases in a batch process
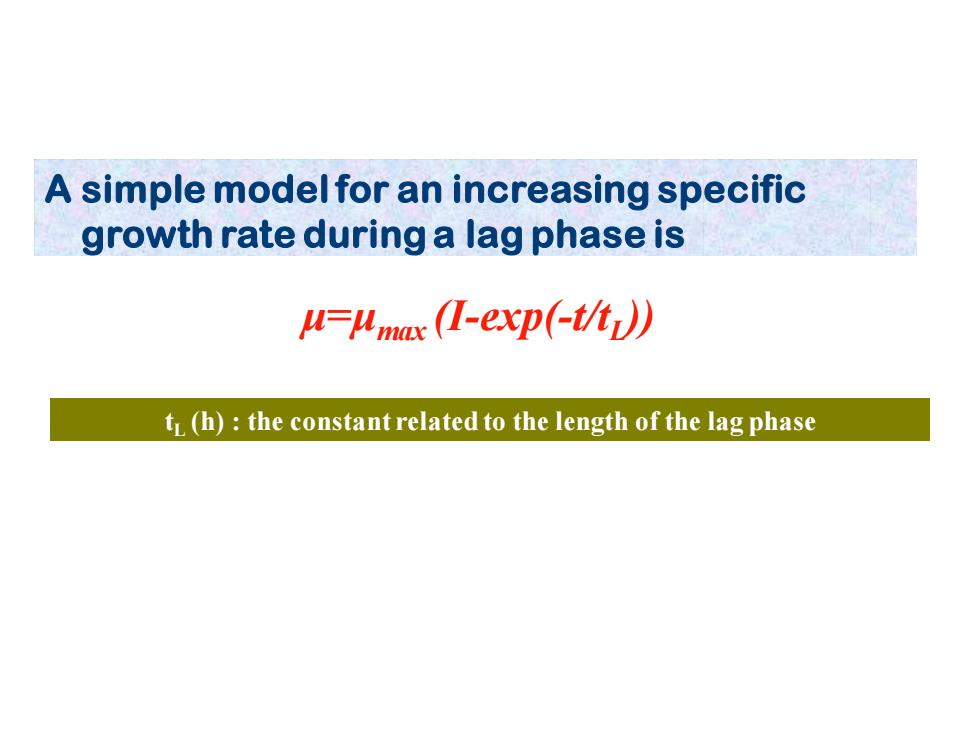
A simple modelfor an increasing specific growth rate during a lag phase is ='mx(-exp(-tt》 tL (h):the constant related to the length of the lag phase
A simple model for an increasing specific growth rate during a lag phase is μ=μmax (I-exp(-t/tL )) tL (h) : the constant related to the length of the lag phase
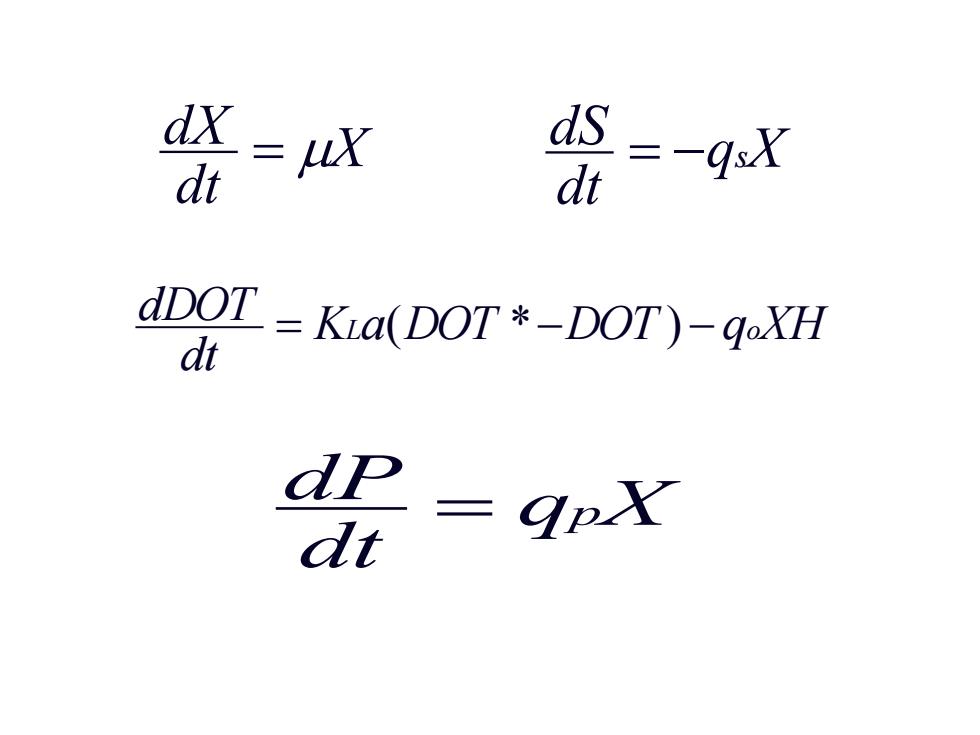
dx dt =uX d dt =-4X dDOT=Kia(DOT *-DOT)-qoXH dt dp=qox dt
X dt dX = q X dt dS = − s K a DOT DOT q XH dt dDOT = L ( *− ) − o q X dt dP = p

10 20 100 D01 216012nS (8)100 0 of 0 -0.5 ogx DOT Time (h) 10 Simulation of batch processes onentially until the C/energy substrate(S) 18℃0n气2<4 Constants used:qs.max=I h1:Ks.s=0.05 kg m-3:Ks.o=5 air sat; Yx/s 0.5 kg:Yo/s=0.5 kg kg-1.KLa 500 h-1 (250 h-1 in the middle curve)

6.2.Continuous fermentation F (1-6y F2 8y Classification of continuous processes based on the flow patter.Left:Single stag Middle:Single stage with recirculation;Right:Two stage with optional two stream medium
6.2. Continuous fermentation
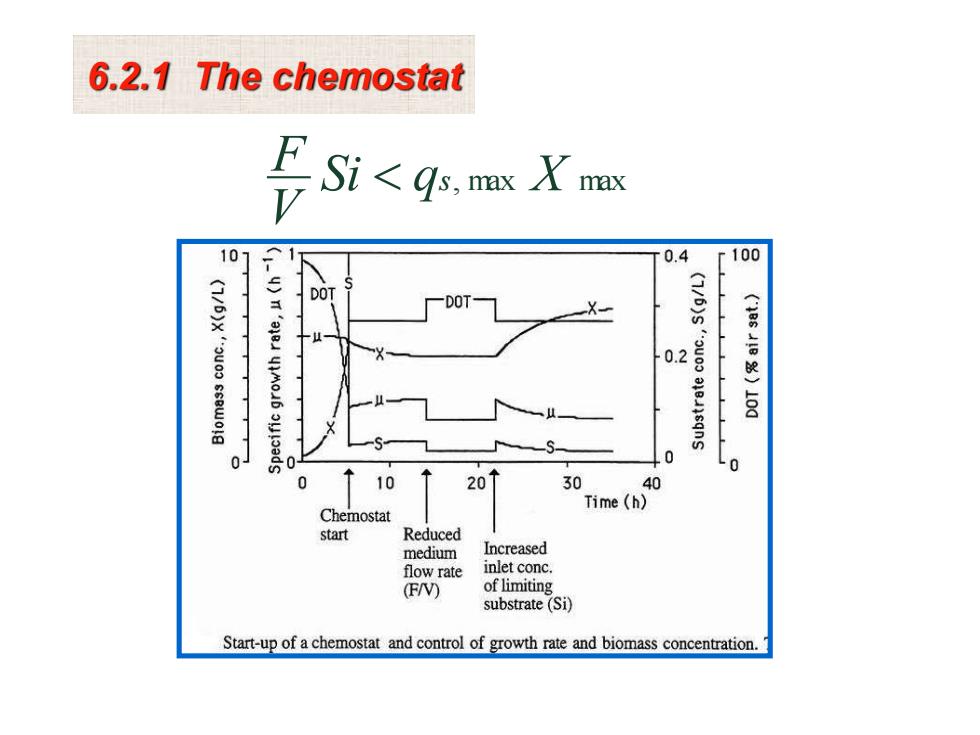
6.2.1 The chemostat Si<qs,mx X max 101 0.4 r100 DOT DOT- X 0.2 (3=51m5)101 0 0 Lo 0 10 20 30 40 Time (h) Chemostat start Reduced medium Increased flow rate inlet conc (F/V) of limiting substrate (Si) Start-up of a chemostat and control of growth rate and biomass concentration
Si q , max X max V F s 6.2.1 The chemostat