正在加载图片...
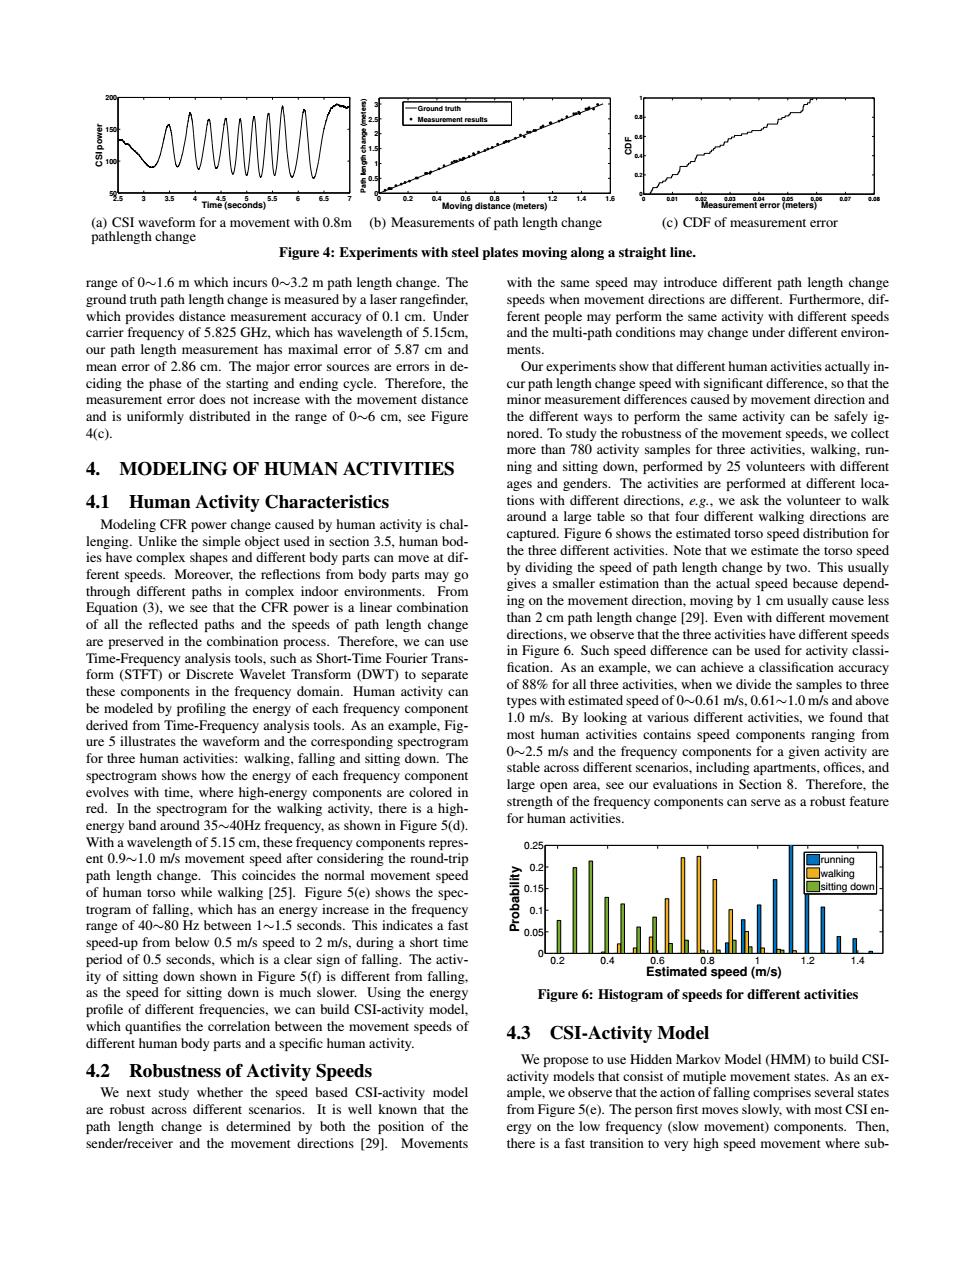
35 Time (seconds) 65 Moving is(meter) 0.6 14 easmen2产 (a)CSI waveform for a movement with 0.8m (b)Measurements of path length change (c)CDF of measurement error pathlength change Figure 4:Experiments with steel plates moving along a straight line. range of 0~1.6 m which incurs 0~3.2 m path length change.The with the same speed may introduce different path length change ground truth path length change is measured by a laser rangefinder. speeds when movement directions are different.Furthermore,dif- which provides distance measurement accuracy of 0.1 cm.Under ferent people may perform the same activity with different speeds carrier frequency of 5.825 GHz,which has wavelength of 5.15cm. and the multi-path conditions may change under different environ- our path length measurement has maximal error of 5.87 cm and ments. mean error of 2.86 cm.The major error sources are errors in de- Our experiments show that different human activities actually in- ciding the phase of the starting and ending cycle.Therefore,the cur path length change speed with significant difference,so that the measurement error does not increase with the movement distance minor measurement differences caused by movement direction and and is uniformly distributed in the range of 0~6 cm,see Figure the different ways to perform the same activity can be safely ig- 4(c). nored.To study the robustness of the movement speeds,we collect more than 780 activity samples for three activities,walking,run- 4. MODELING OF HUMAN ACTIVITIES ning and sitting down,performed by 25 volunteers with different ages and genders.The activities are performed at different loca- 4.1 Human Activity Characteristics tions with different directions,e.g.,we ask the volunteer to walk Modeling CFR power change caused by human activity is chal- around a large table so that four different walking directions are lenging.Unlike the simple object used in section 3.5,human bod captured.Figure 6 shows the estimated torso speed distribution for ies have complex shapes and different body parts can move at dif- the three different activities.Note that we estimate the torso speed ferent speeds.Moreover,the reflections from body parts may go by dividing the speed of path length change by two.This usually through different paths in complex indoor environments.From gives a smaller estimation than the actual speed because depend Equation (3),we see that the CFR power is a linear combination ing on the movement direction,moving by 1 cm usually cause less of all the reflected paths and the speeds of path length change than 2 cm path length change [29].Even with different movement are preserved in the combination process.Therefore,we can use directions,we observe that the three activities have different speeds Time-Frequency analysis tools,such as Short-Time Fourier Trans- in Figure 6.Such speed difference can be used for activity classi- form (STFT)or Discrete Wavelet Transform (DWT)to separate fication.As an example,we can achieve a classification accuracy these components in the frequency domain.Human activity can of 88%for all three activities,when we divide the samples to three be modeled by profiling the energy of each frequency component types with estimated speed of 0~0.61 m/s,0.61~1.0 m/s and above 1.0 m/s.By looking at various different activities,we found that derived from Time-Frequency analysis tools.As an example,Fig- ure 5 illustrates the waveform and the corresponding spectrogram most human activities contains speed components ranging from for three human activities:walking.falling and sitting down.The 0~2.5 m/s and the frequency components for a given activity are spectrogram shows how the energy of each frequency component stable across different scenarios,including apartments,offices,and evolves with time,where high-energy components are colored in large open area,see our evaluations in Section 8.Therefore,the red.In the spectrogram for the walking activity,there is a high- strength of the frequency components can serve as a robust feature energy band around 35~40Hz frequency,as shown in Figure 5(d). for human activities. With a wavelength of 5.15 cm,these frequency components repres- 025 ent 0.91.0 m/s movement speed after considering the round-trip path length change.This coincides the normal movement speed of human torso while walking [25].Figure 5(e)shows the spec- 0.15 sitting dow trogram of falling,which has an energy increase in the frequency range of 40~80 Hz between 1~1.5 seconds.This indicates a fast speed-up from below 0.5 m/s speed to 2 m/s,during a short time period of 0.5 seconds,which is a clear sign of falling.The activ- 0.4 08 ity of sitting down shown in Figure 5(f)is different from falling. Estimated speed(m/s) as the speed for sitting down is much slower.Using the energy Figure 6:Histogram of speeds for different activities profile of different frequencies,we can build CSI-activity model. which quantifies the correlation between the movement speeds of 4.3 different human body parts and a specific human activity. CSI-Activity Model We propose to use Hidden Markov Model (HMM)to build CSI- 4.2 Robustness of Activity Speeds activity models that consist of mutiple movement states.As an ex- We next study whether the speed based CSI-activity model ample,we observe that the action of falling comprises several states are robust across different scenarios.It is well known that the from Figure 5(e).The person first moves slowly,with most CSI en- path length change is determined by both the position of the ergy on the low frequency (slow movement)components.Then. sender/receiver and the movement directions [29].Movements there is a fast transition to very high speed movement where sub-2.5 3 3.5 4 4.5 5 5.5 6 6.5 7 50 100 150 200 Time (seconds) CSI power (a) CSI waveform for a movement with 0.8m pathlength change 0 0.2 0.4 0.6 0.8 1 1.2 1.4 1.6 0 0.5 1 1.5 2 2.5 3 Moving distance (meters) Path length change (meters) Ground truth Measurement results (b) Measurements of path length change 0 0.01 0.02 0.03 0.04 0.05 0.06 0.07 0.08 0 0.2 0.4 0.6 0.8 1 Measurement error (meters) CDF (c) CDF of measurement error Figure 4: Experiments with steel plates moving along a straight line. range of 0∼1.6 m which incurs 0∼3.2 m path length change. The ground truth path length change is measured by a laser rangefinder, which provides distance measurement accuracy of 0.1 cm. Under carrier frequency of 5.825 GHz, which has wavelength of 5.15cm, our path length measurement has maximal error of 5.87 cm and mean error of 2.86 cm. The major error sources are errors in deciding the phase of the starting and ending cycle. Therefore, the measurement error does not increase with the movement distance and is uniformly distributed in the range of 0∼6 cm, see Figure 4(c). 4. MODELING OF HUMAN ACTIVITIES 4.1 Human Activity Characteristics Modeling CFR power change caused by human activity is challenging. Unlike the simple object used in section 3.5, human bodies have complex shapes and different body parts can move at different speeds. Moreover, the reflections from body parts may go through different paths in complex indoor environments. From Equation (3), we see that the CFR power is a linear combination of all the reflected paths and the speeds of path length change are preserved in the combination process. Therefore, we can use Time-Frequency analysis tools, such as Short-Time Fourier Transform (STFT) or Discrete Wavelet Transform (DWT) to separate these components in the frequency domain. Human activity can be modeled by profiling the energy of each frequency component derived from Time-Frequency analysis tools. As an example, Figure 5 illustrates the waveform and the corresponding spectrogram for three human activities: walking, falling and sitting down. The spectrogram shows how the energy of each frequency component evolves with time, where high-energy components are colored in red. In the spectrogram for the walking activity, there is a highenergy band around 35∼40Hz frequency, as shown in Figure 5(d). With a wavelength of 5.15 cm, these frequency components represent 0.9∼1.0 m/s movement speed after considering the round-trip path length change. This coincides the normal movement speed of human torso while walking [25]. Figure 5(e) shows the spectrogram of falling, which has an energy increase in the frequency range of 40∼80 Hz between 1∼1.5 seconds. This indicates a fast speed-up from below 0.5 m/s speed to 2 m/s, during a short time period of 0.5 seconds, which is a clear sign of falling. The activity of sitting down shown in Figure 5(f) is different from falling, as the speed for sitting down is much slower. Using the energy profile of different frequencies, we can build CSI-activity model, which quantifies the correlation between the movement speeds of different human body parts and a specific human activity. 4.2 Robustness of Activity Speeds We next study whether the speed based CSI-activity model are robust across different scenarios. It is well known that the path length change is determined by both the position of the sender/receiver and the movement directions [29]. Movements with the same speed may introduce different path length change speeds when movement directions are different. Furthermore, different people may perform the same activity with different speeds and the multi-path conditions may change under different environments. Our experiments show that different human activities actually incur path length change speed with significant difference, so that the minor measurement differences caused by movement direction and the different ways to perform the same activity can be safely ignored. To study the robustness of the movement speeds, we collect more than 780 activity samples for three activities, walking, running and sitting down, performed by 25 volunteers with different ages and genders. The activities are performed at different locations with different directions, e.g., we ask the volunteer to walk around a large table so that four different walking directions are captured. Figure 6 shows the estimated torso speed distribution for the three different activities. Note that we estimate the torso speed by dividing the speed of path length change by two. This usually gives a smaller estimation than the actual speed because depending on the movement direction, moving by 1 cm usually cause less than 2 cm path length change [29]. Even with different movement directions, we observe that the three activities have different speeds in Figure 6. Such speed difference can be used for activity classi- fication. As an example, we can achieve a classification accuracy of 88% for all three activities, when we divide the samples to three types with estimated speed of 0∼0.61 m/s, 0.61∼1.0 m/s and above 1.0 m/s. By looking at various different activities, we found that most human activities contains speed components ranging from 0∼2.5 m/s and the frequency components for a given activity are stable across different scenarios, including apartments, offices, and large open area, see our evaluations in Section 8. Therefore, the strength of the frequency components can serve as a robust feature for human activities. 0.2 0.4 0.6 0.8 1 1.2 1.4 0 0.05 0.1 0.15 0.2 0.25 Estimated speed (m/s) Probability running walking sitting down Figure 6: Histogram of speeds for different activities 4.3 CSI-Activity Model We propose to use Hidden Markov Model (HMM) to build CSIactivity models that consist of mutiple movement states. As an example, we observe that the action of falling comprises several states from Figure 5(e). The person first moves slowly, with most CSI energy on the low frequency (slow movement) components. Then, there is a fast transition to very high speed movement where sub-