正在加载图片...

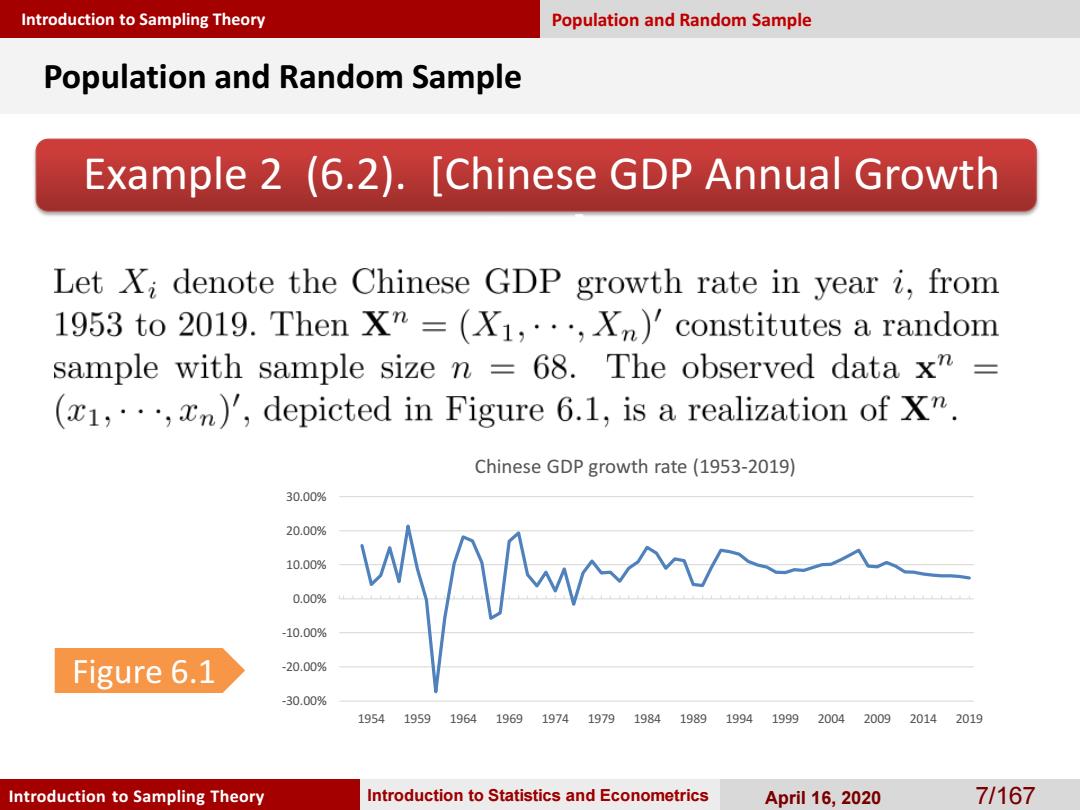
Introduction to Sampling Theory Population and Random Sample Population and Random Sample Example 2 (6.2).[Chinese GDP Annual Growth Let Xi denote the Chinese GDP growth rate in year i,from 1953 to 2019.Then X"=(X1,...,Xn)'constitutes a random sample with sample size n -68.The observed data x"= (1,,n)',depicted in Figure 6.1,is a realization of xn. Chinese GDP growth rate(1953-2019) 30.00% 20.00% 10.00% 0.00% -10.00% Figure 6.1 -20.00% -30.00% 19541959196419691974197919841989199419992004200920142019 Introduction to Sampling Theory Introduction to Statistics and Econometrics April 16,2020 71167Introduction to Sampling Theory Introduction to Sampling Theory Introduction to Statistics and Econometrics April 16, 2020 7/167 Example 2 (6.2). [Chinese GDP Annual Growth Rate] Population and Random Sample Population and Random Sample Figure 6.1 -30.00% -20.00% -10.00% 0.00% 10.00% 20.00% 30.00% 1954 1959 1964 1969 1974 1979 1984 1989 1994 1999 2004 2009 2014 2019 Chinese GDP growth rate (1953-2019)