誉院宾所清怨南鱼王季大門厦黄 Multivariate Probability Distributions Professor Yongmiao Hong Cornell University April 16,2020
Multivariate Probability Distributions Professor Yongmiao Hong Cornell University April 16, 2020
CONTENTS 6.1 Population and Random Sample 6.2 Sampling Distribution of Sample Mean 6.3 Sampling Distribution of Sample Variance 6.4 Student's t-Distribution 6.5 Snedecor's F Distribution 6,6 Sufficient Statistics 6.7 Conclusion Introduction to Sampling Theory Introduction to Statistics and Econometrics April 16,2020 2/167
Introduction to Sampling Theory Introduction to Statistics and Econometrics April 16, 2020 2/167 6.1 Population and Random Sample 6.2 Sampling Distribution of Sample Mean 6.3 Sampling Distribution of Sample Variance 6.4 Student’s t-Distribution 6.5 Snedecor's F Distribution 6.6 Sufficient Statistics 6.7 Conclusion CONTENTS
Introduction to Sampling Theory Population and Random Sample Population and Random Sample Statistical analysis is based on outcomes of a large number of repeated random experiments of same or similar kind. Suppose a random variable Xi denotes the outcome of the i-th experiment.We then obtain a sequence of out- comes,X1,...,Xn,if n experiments are implemented. .This sequence of outcomes then constitutes a so-called random sample from which one can make inference of the underlying probability law which has generated the observed data. Introduction to Sampling Theory Introduction to Statistics and Econometrics April 16,2020 3/167
Introduction to Sampling Theory Introduction to Sampling Theory Introduction to Statistics and Econometrics April 16, 2020 3/167 Population and Random Sample Population and Random Sample
Introduction to Sampling Theory Population and Random Sample Population and Random Sample Definition 1(6.1).[Random Sample] A random sample,denoted as X"=(X1,..,X),is a sequence of n random variables X1,...,Xn. A realization of the random sample X",denoted as x"= (1,,n),is called a data set generated from X"or a sample point of Xr. A random sample Xm can generate many different data sets. The collection of all possible sample points of X"constitutes the sample space of the random sample X". Introduction to Sampling Theory Introduction to Statistics and Econometrics April 16,2020 4/167
Introduction to Sampling Theory Introduction to Sampling Theory Introduction to Statistics and Econometrics April 16, 2020 4/167 Definition 1 (6.1). [Random Sample] Population and Random Sample Population and Random Sample

Introduction to Sampling Theory Population and Random Sample Population and Random Sample Example 1 (6.1).[Throwing n Coins] Let Xi denote the outcome of throwing the i-th coin,with Xi=1 if the head shows up,and Xi=0 if the tail shows up. Then X"=(X1,...,Xn)'constitutes a random sample. If we throw n coins,we will obtain a sequence of real numbers, such as xn=(1,1,0,0,1,0,·,1). This sequence is a data set of size n from the random sample Xn. Introduction to Sampling Theory Introduction to Statistics and Econometrics April 16,2020 5/167
Introduction to Sampling Theory Introduction to Sampling Theory Introduction to Statistics and Econometrics April 16, 2020 5/167 Example 1 (6.1). [Throwing n Coins] Population and Random Sample Population and Random Sample
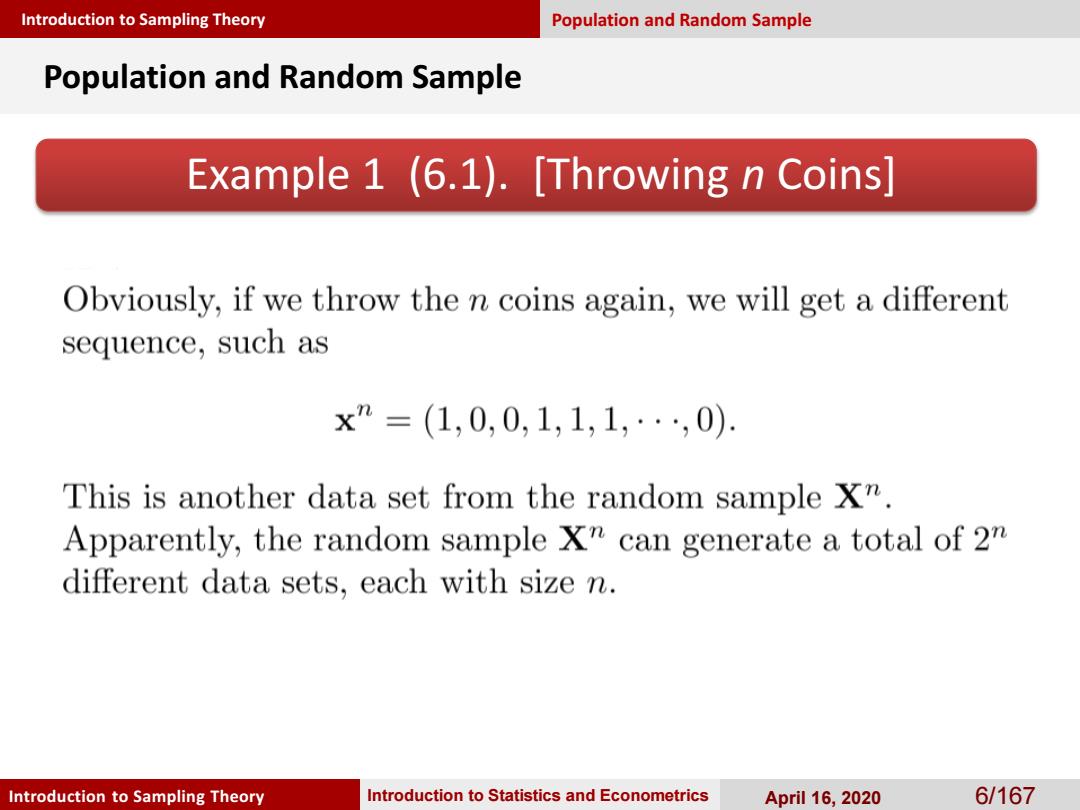
Introduction to Sampling Theory Population and Random Sample Population and Random Sample Example 1 (6.1).[Throwing n Coins] Obviously,if we throw the n coins again,we will get a different sequence,such as x”=(1,0,0,1,1,1,,0). This is another data set from the random sample X". Apparently,the random sample X"can generate a total of 2m different data sets,each with size n. Introduction to Sampling Theory Introduction to Statistics and Econometrics April 16,2020 6/167
Introduction to Sampling Theory Introduction to Sampling Theory Introduction to Statistics and Econometrics April 16, 2020 6/167 Example 1 (6.1). [Throwing n Coins] Population and Random Sample Population and Random Sample
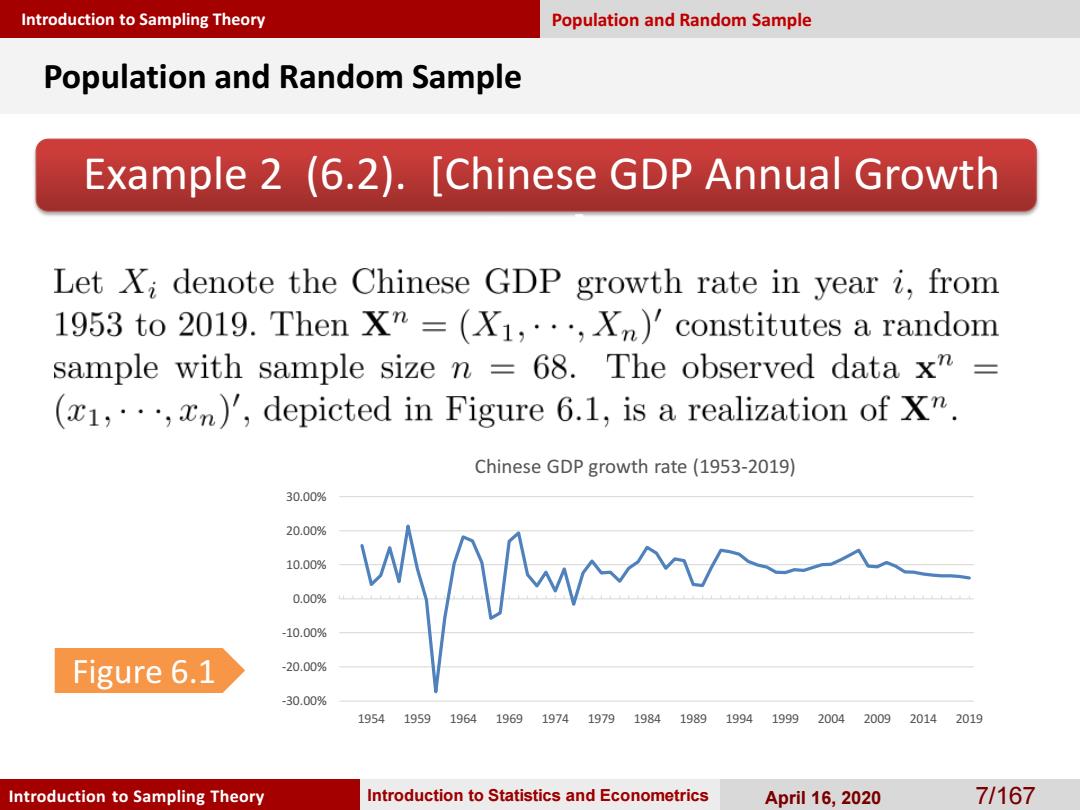
Introduction to Sampling Theory Population and Random Sample Population and Random Sample Example 2 (6.2).[Chinese GDP Annual Growth Let Xi denote the Chinese GDP growth rate in year i,from 1953 to 2019.Then X"=(X1,...,Xn)'constitutes a random sample with sample size n -68.The observed data x"= (1,,n)',depicted in Figure 6.1,is a realization of xn. Chinese GDP growth rate(1953-2019) 30.00% 20.00% 10.00% 0.00% -10.00% Figure 6.1 -20.00% -30.00% 19541959196419691974197919841989199419992004200920142019 Introduction to Sampling Theory Introduction to Statistics and Econometrics April 16,2020 71167
Introduction to Sampling Theory Introduction to Sampling Theory Introduction to Statistics and Econometrics April 16, 2020 7/167 Example 2 (6.2). [Chinese GDP Annual Growth Rate] Population and Random Sample Population and Random Sample Figure 6.1 -30.00% -20.00% -10.00% 0.00% 10.00% 20.00% 30.00% 1954 1959 1964 1969 1974 1979 1984 1989 1994 1999 2004 2009 2014 2019 Chinese GDP growth rate (1953-2019)

Introduction to Sampling Theory Population and Random Sample Population and Random Sample Example 3 (6.3).[S&P 500 price index] Let Xi be the return on S&P500 price index at day i,from January 4,1960 to December 31,2010.Then XT=(X1,.. .Xn)forms a random sample with size n 12839. The observed data set x"=(x1,..,xn),depicted in Figure 6.2,is a realization of the random sample X". 0.10 S&P500日收益率 0.05 0.00 0.05 -0.10 Figure 6.2 0.15 0.20f 19601965197019751980198519901995200020052010 Introduction to Sampling Theory Introduction to Statistics and Econometrics April 16,2020 8/167
Introduction to Sampling Theory Introduction to Sampling Theory Introduction to Statistics and Econometrics April 16, 2020 8/167 Example 3 (6.3). [S&P 500 price index] Population and Random Sample Population and Random Sample Figure 6.2
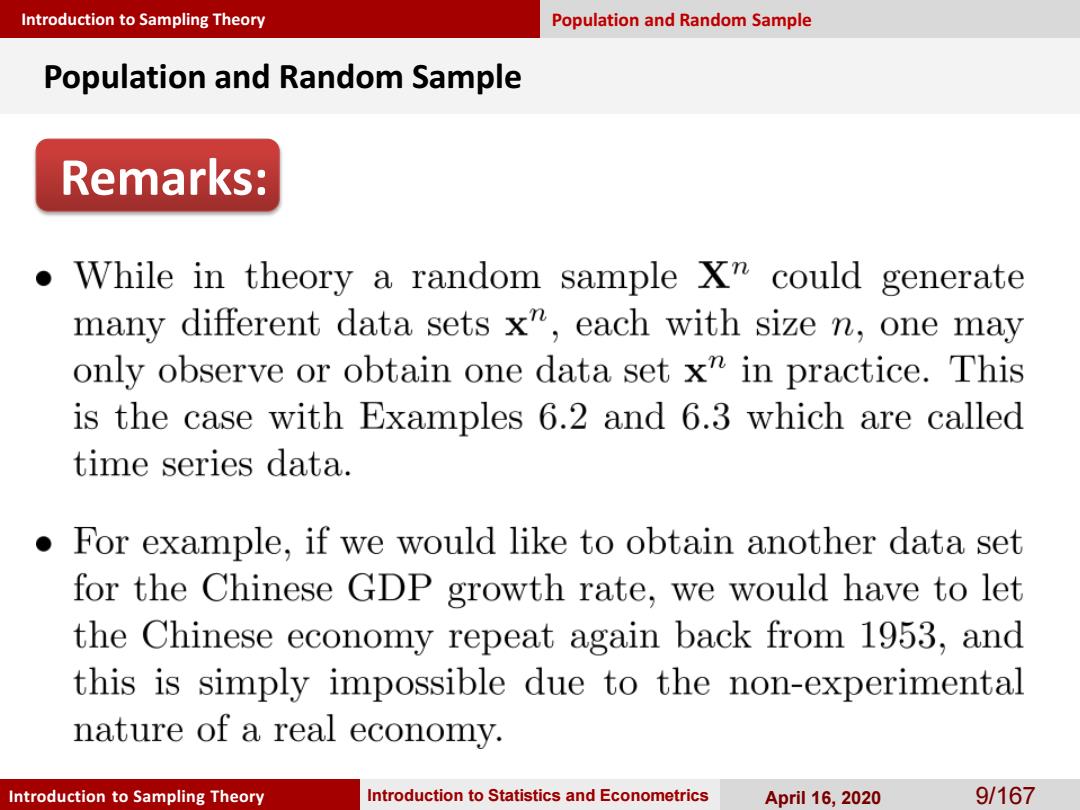
Introduction to Sampling Theory Population and Random Sample Population and Random Sample Remarks: While in theory a random sample X"could generate many different data sets x",each with size n,one may only observe or obtain one data set x"in practice.This is the case with Examples 6.2 and 6.3 which are called time series data. For example,if we would like to obtain another data set for the Chinese GDP growth rate,we would have to let the Chinese economy repeat again back from 1953,and this is simply impossible due to the non-experimental nature of a real economy. Introduction to Sampling Theory Introduction to Statistics and Econometrics April 16,2020 9/167
Introduction to Sampling Theory Introduction to Sampling Theory Introduction to Statistics and Econometrics April 16, 2020 9/167 Population and Random Sample Population and Random Sample Remarks:
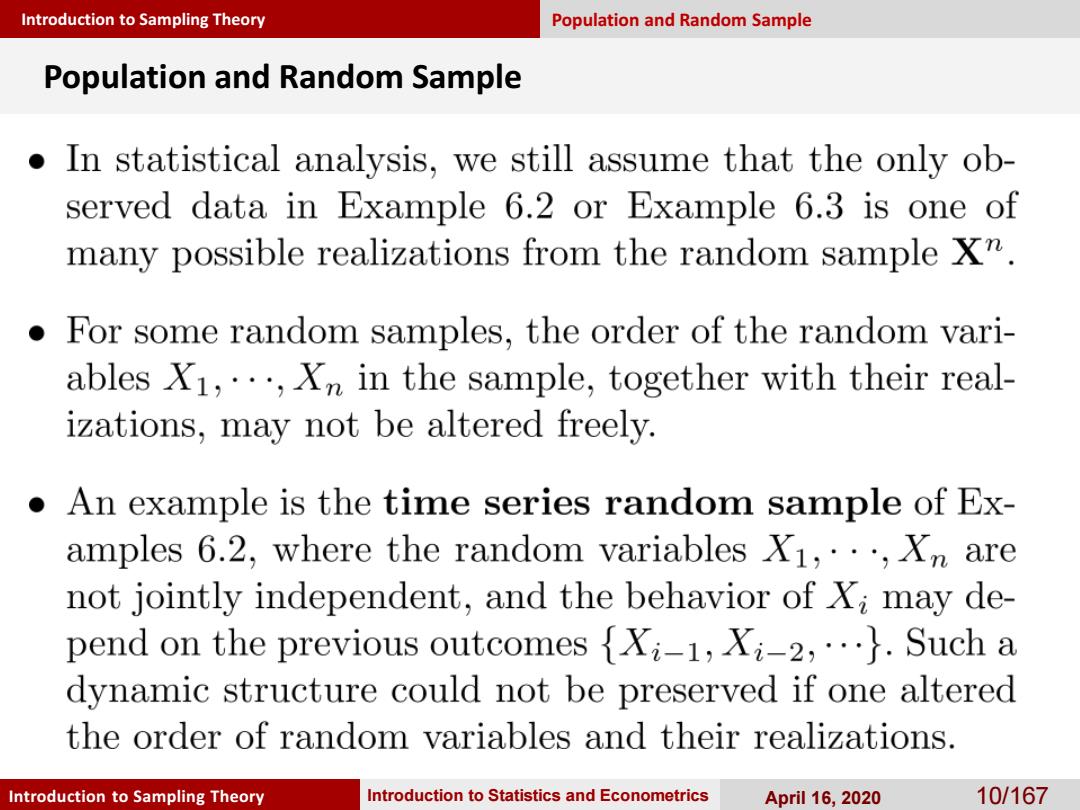
Introduction to Sampling Theory Population and Random Sample Population and Random Sample In statistical analysis,we still assume that the only ob- served data in Example 6.2 or Example 6.3 is one of many possible realizations from the random sample X". For some random samples,the order of the random vari- ables X1,...,Xn in the sample,together with their real- izations,may not be altered freely. An example is the time series random sample of Ex- amples 6.2,where the random variables X1,...,Xn are not jointly independent,and the behavior of X;may de- pend on the previous outcomes {X-1,X:-2,..}.Such a dynamic structure could not be preserved if one altered the order of random variables and their realizations. Introduction to Sampling Theory Introduction to Statistics and Econometrics April 16,2020 10/167
Introduction to Sampling Theory Introduction to Sampling Theory Introduction to Statistics and Econometrics April 16, 2020 10/167 Population and Random Sample Population and Random Sample