正在加载图片...
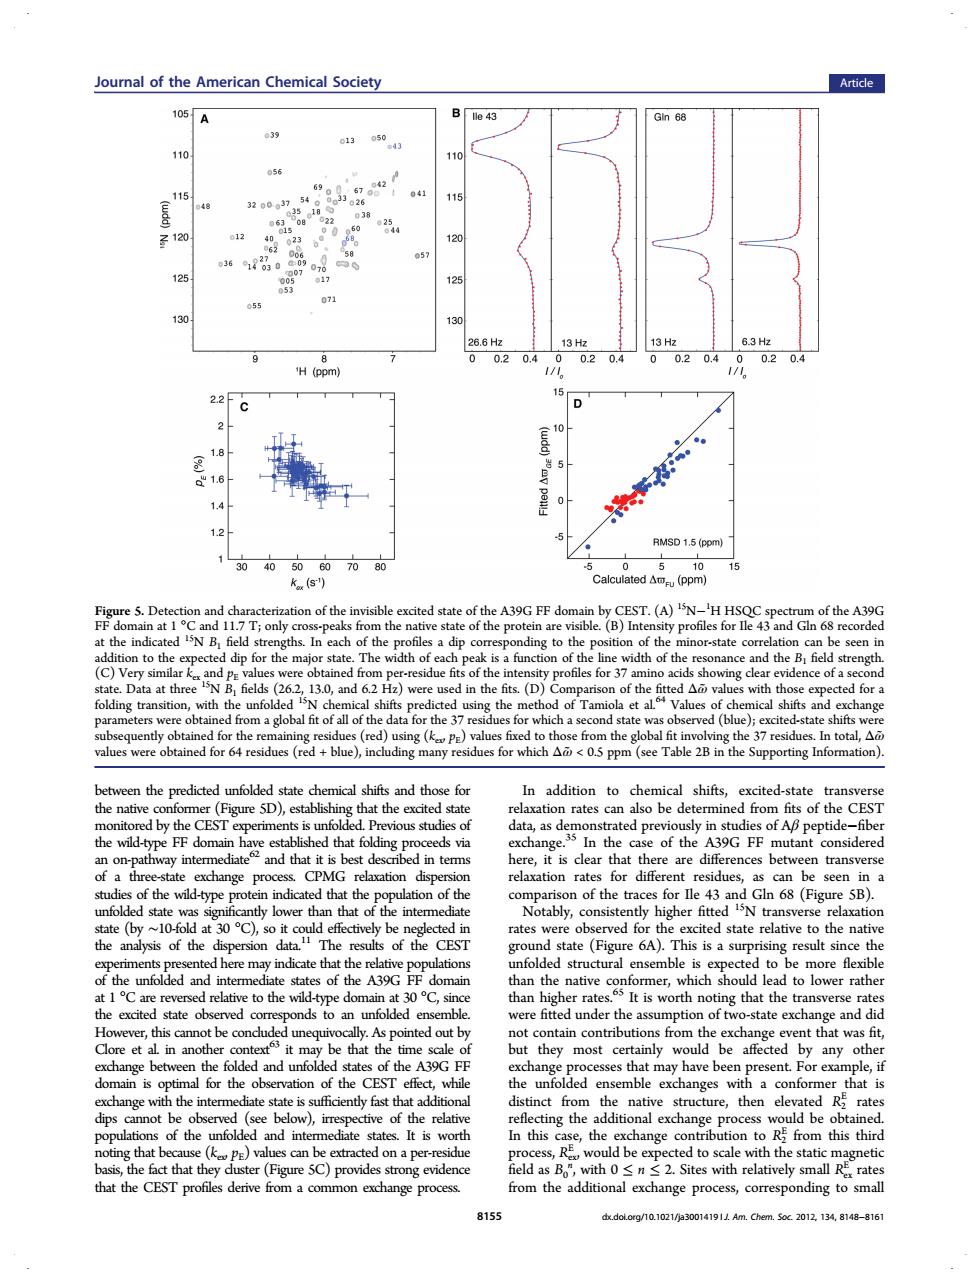
Joumnal of the American Chemical Society Article 39 056 15 841 z120 125 0204 H(pom 15 2.2 C 5 5 D 1.5 (ppm 0 (pm of the by CEST.(A)N-'H HSQ of theA39G of a g tran t a hemical shifts predicte tate and t n additio shifts excited-state at tud of Ap pepti nd that i here it is hat t s betw trans 0dt30℃ ably,c gher fitt CES te(Figure 6A).This is a sup the unfolded and e may more of th the is worth no g that nd dic t6 s from that w ded and unfolde of the 390 that ma le.i ther ing the DE k to sc with th hat the CEST profiles deriv from the additi nding to small 8159 dxdolerg/10.1021/)30014191 Am.Cherm.Soc.2012.134.8148-816between the predicted unfolded state chemical shifts and those for the native conformer (Figure 5D), establishing that the excited state monitored by the CEST experiments is unfolded. Previous studies of the wild-type FF domain have established that folding proceeds via an on-pathway intermediate62 and that it is best described in terms of a three-state exchange process. CPMG relaxation dispersion studies of the wild-type protein indicated that the population of the unfolded state was significantly lower than that of the intermediate state (by ∼10-fold at 30 °C), so it could effectively be neglected in the analysis of the dispersion data.11 The results of the CEST experiments presented here may indicate that the relative populations of the unfolded and intermediate states of the A39G FF domain at 1 °C are reversed relative to the wild-type domain at 30 °C, since the excited state observed corresponds to an unfolded ensemble. However, this cannot be concluded unequivocally. As pointed out by Clore et al. in another context63 it may be that the time scale of exchange between the folded and unfolded states of the A39G FF domain is optimal for the observation of the CEST effect, while exchange with the intermediate state is sufficiently fast that additional dips cannot be observed (see below), irrespective of the relative populations of the unfolded and intermediate states. It is worth noting that because (kex, pE) values can be extracted on a per-residue basis, the fact that they cluster (Figure 5C) provides strong evidence that the CEST profiles derive from a common exchange process. In addition to chemical shifts, excited-state transverse relaxation rates can also be determined from fits of the CEST data, as demonstrated previously in studies of Aβ peptide−fiber exchange.35 In the case of the A39G FF mutant considered here, it is clear that there are differences between transverse relaxation rates for different residues, as can be seen in a comparison of the traces for Ile 43 and Gln 68 (Figure 5B). Notably, consistently higher fitted 15N transverse relaxation rates were observed for the excited state relative to the native ground state (Figure 6A). This is a surprising result since the unfolded structural ensemble is expected to be more flexible than the native conformer, which should lead to lower rather than higher rates.65 It is worth noting that the transverse rates were fitted under the assumption of two-state exchange and did not contain contributions from the exchange event that was fit, but they most certainly would be affected by any other exchange processes that may have been present. For example, if the unfolded ensemble exchanges with a conformer that is distinct from the native structure, then elevated R2 E rates reflecting the additional exchange process would be obtained. In this case, the exchange contribution to R2 E from this third process, Rex E , would be expected to scale with the static magnetic field as B0 n , with 0 ≤ n ≤ 2. Sites with relatively small Rex E rates from the additional exchange process, corresponding to small Figure 5. Detection and characterization of the invisible excited state of the A39G FF domain by CEST. (A) 15N−1 H HSQC spectrum of the A39G FF domain at 1 °C and 11.7 T; only cross-peaks from the native state of the protein are visible. (B) Intensity profiles for Ile 43 and Gln 68 recorded at the indicated 15N B1 field strengths. In each of the profiles a dip corresponding to the position of the minor-state correlation can be seen in addition to the expected dip for the major state. The width of each peak is a function of the line width of the resonance and the B1 field strength. (C) Very similar kex and pE values were obtained from per-residue fits of the intensity profiles for 37 amino acids showing clear evidence of a second state. Data at three 15N B1 fields (26.2, 13.0, and 6.2 Hz) were used in the fits. (D) Comparison of the fitted Δω̃values with those expected for a folding transition, with the unfolded 15N chemical shifts predicted using the method of Tamiola et al.64 Values of chemical shifts and exchange parameters were obtained from a global fit of all of the data for the 37 residues for which a second state was observed (blue); excited-state shifts were subsequently obtained for the remaining residues (red) using (kex, pE) values fixed to those from the global fit involving the 37 residues. In total, Δω̃ values were obtained for 64 residues (red + blue), including many residues for which Δω̃< 0.5 ppm (see Table 2B in the Supporting Information). Journal of the American Chemical Society Article 8155 dx.doi.org/10.1021/ja3001419 | J. Am. Chem. Soc. 2012, 134, 8148−8161