正在加载图片...
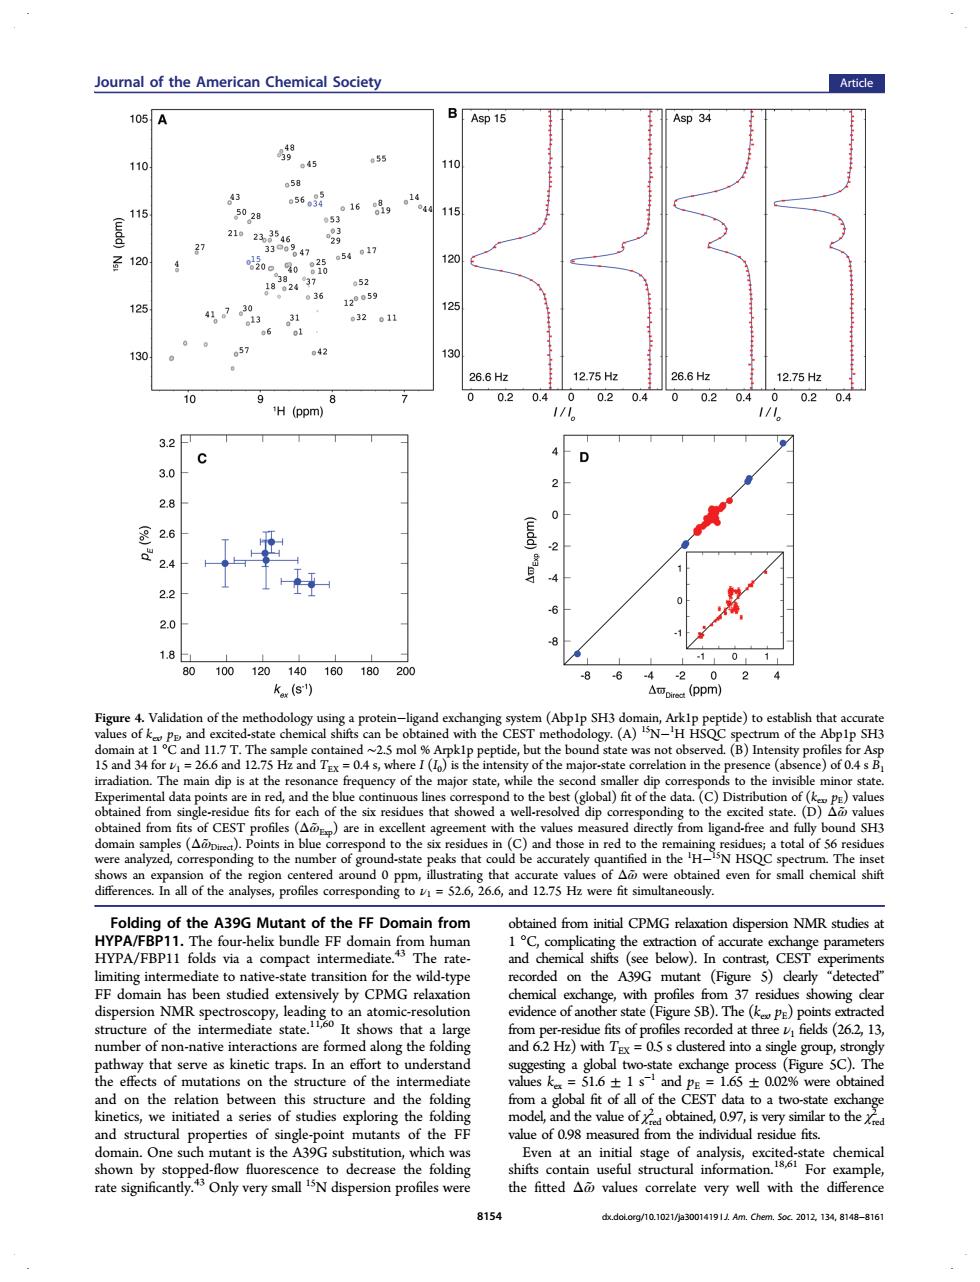
oural of the American Chemical Society Article 105A Asp 15 p34 110 45 16g 。14 28 47 17 12 36 125 。 21n 57 42 H (ppm) 32 3.0 28 里26 24 22 2.0 18 100120140 160180 8 -6 4 k(s) (ppm) 2 Figure 4.Valid ten-ligand (bpp)h 5 an 5 Hz and T. n th )of 04s CEST ctly d-fre n the H of the of Ag nces.In all of the ar g to 52.6, 6.6,and 12.75 Hz were fit simultaneously. A39G nt of FF Do from ed f CPMG relaxat dispersion NMR studi compact inte in Th rate an atom sta (Figure 5B).The alo r th :05s du ed into a sin ha。f mutati the unde ediat on the rela tion and structural properties of oint mutants of the FE value of 098 meast On e such t is the A3 even at an initial stage of 191 Am .Chem.Soc.2012.134,8148-810 Folding of the A39G Mutant of the FF Domain from HYPA/FBP11. The four-helix bundle FF domain from human HYPA/FBP11 folds via a compact intermediate.43 The ratelimiting intermediate to native-state transition for the wild-type FF domain has been studied extensively by CPMG relaxation dispersion NMR spectroscopy, leading to an atomic-resolution structure of the intermediate state.11,60 It shows that a large number of non-native interactions are formed along the folding pathway that serve as kinetic traps. In an effort to understand the effects of mutations on the structure of the intermediate and on the relation between this structure and the folding kinetics, we initiated a series of studies exploring the folding and structural properties of single-point mutants of the FF domain. One such mutant is the A39G substitution, which was shown by stopped-flow fluorescence to decrease the folding rate significantly.43 Only very small 15N dispersion profiles were obtained from initial CPMG relaxation dispersion NMR studies at 1 °C, complicating the extraction of accurate exchange parameters and chemical shifts (see below). In contrast, CEST experiments recorded on the A39G mutant (Figure 5) clearly “detected” chemical exchange, with profiles from 37 residues showing clear evidence of another state (Figure 5B). The (kex, pE) points extracted from per-residue fits of profiles recorded at three ν1 fields (26.2, 13, and 6.2 Hz) with TEX = 0.5 s clustered into a single group, strongly suggesting a global two-state exchange process (Figure 5C). The values kex = 51.6 ± 1 s−1 and pE = 1.65 ± 0.02% were obtained from a global fit of all of the CEST data to a two-state exchange model, and the value of χred 2 obtained, 0.97, is very similar to the χred 2 value of 0.98 measured from the individual residue fits. Even at an initial stage of analysis, excited-state chemical shifts contain useful structural information.18,61 For example, the fitted Δω̃ values correlate very well with the difference Figure 4. Validation of the methodology using a protein−ligand exchanging system (Abp1p SH3 domain, Ark1p peptide) to establish that accurate values of kex, pE, and excited-state chemical shifts can be obtained with the CEST methodology. (A) 15N−1 H HSQC spectrum of the Abp1p SH3 domain at 1 °C and 11.7 T. The sample contained ∼2.5 mol % Arpk1p peptide, but the bound state was not observed. (B) Intensity profiles for Asp 15 and 34 for ν1 = 26.6 and 12.75 Hz and TEX = 0.4 s, where I (I0) is the intensity of the major-state correlation in the presence (absence) of 0.4 s B1 irradiation. The main dip is at the resonance frequency of the major state, while the second smaller dip corresponds to the invisible minor state. Experimental data points are in red, and the blue continuous lines correspond to the best (global) fit of the data. (C) Distribution of (kex, pE) values obtained from single-residue fits for each of the six residues that showed a well-resolved dip corresponding to the excited state. (D) Δω̃ values obtained from fits of CEST profiles (Δω̃ Exp) are in excellent agreement with the values measured directly from ligand-free and fully bound SH3 domain samples (Δω̃ Direct). Points in blue correspond to the six residues in (C) and those in red to the remaining residues; a total of 56 residues were analyzed, corresponding to the number of ground-state peaks that could be accurately quantified in the 1 H−15N HSQC spectrum. The inset shows an expansion of the region centered around 0 ppm, illustrating that accurate values of Δω̃ were obtained even for small chemical shift differences. In all of the analyses, profiles corresponding to ν1 = 52.6, 26.6, and 12.75 Hz were fit simultaneously. Journal of the American Chemical Society Article 8154 dx.doi.org/10.1021/ja3001419 | J. Am. Chem. Soc. 2012, 134, 8148−8161