正在加载图片...
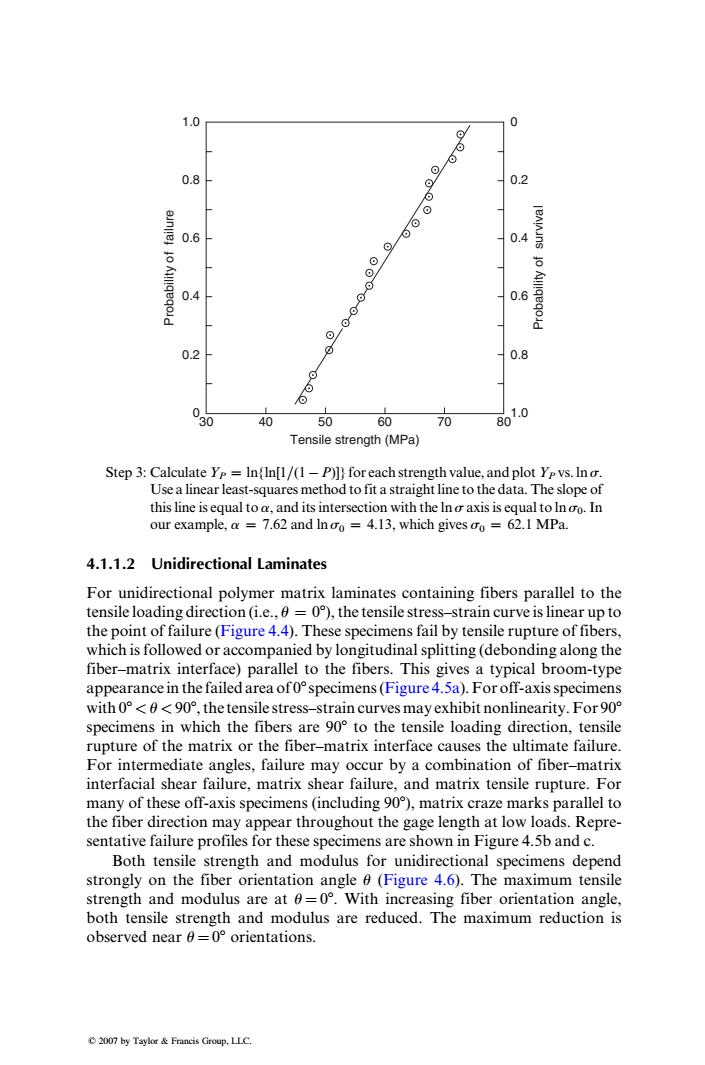
1.0 0 0.8 0.2 einjle] 0.6 可⊙ 0.4 eAlns 0.4 ⊙-⊙⊙0 0.6 ⊙ 0.2 0.8 ⊙ o 0 0 40 50 60 70 801.0 Tensile strength(MPa) Step 3:Calculate Ye In(In[1/(1-P)])for each strength value,and plot Yp vs.Ino. Use a linear least-squares method to fit a straight line to the data.The slope of this line is equal to a,and its intersection with the Ino axis is equal to In oo.In our example,a 7.62 and In oo 4.13,which gives oo 62.1 MPa. 4.1.1.2 Unidirectional Laminates For unidirectional polymer matrix laminates containing fibers parallel to the tensile loading direction(i.e.,=0),the tensile stress-strain curve is linear up to the point of failure(Figure 4.4).These specimens fail by tensile rupture of fibers, which is followed or accompanied by longitudinal splitting(debonding along the fiber-matrix interface)parallel to the fibers.This gives a typical broom-type appearance in the failed area of0specimens(Figure 4.5a).For off-axis specimens with 0°<0<go°,the tensile stress-strain curves may exhibit nonlinearity.For9o° specimens in which the fibers are 90 to the tensile loading direction,tensile rupture of the matrix or the fiber-matrix interface causes the ultimate failure. For intermediate angles,failure may occur by a combination of fiber-matrix interfacial shear failure,matrix shear failure,and matrix tensile rupture.For many of these off-axis specimens (including 90),matrix craze marks parallel to the fiber direction may appear throughout the gage length at low loads.Repre- sentative failure profiles for these specimens are shown in Figure 4.5b and c. Both tensile strength and modulus for unidirectional specimens depend strongly on the fiber orientation angle 0(Figure 4.6).The maximum tensile strength and modulus are at 0=0.With increasing fiber orientation angle, both tensile strength and modulus are reduced.The maximum reduction is observed near 0=0 orientations. 2007 by Taylor Francis Group,LLC1.0 0.8 0.6 0.4 Probability of failure Probability of survival Tensile strength (MPa) 0.2 0 30 40 50 60 70 80 0 0.2 0.4 0.6 0.8 1.0 Step 3: Calculate YP ¼ ln{ln[1=(1 P)]} for each strength value, and plotYP vs. lns. Use a linearleast-squares method to fit a straight line to the data. The slope of thisline is equal to a, and itsintersection with the lns axisis equal to lns0.In our example, a ¼ 7.62 and lns0 ¼ 4.13, which gives s0 ¼ 62.1 MPa. 4.1.1.2 Unidirectional Laminates For unidirectional polymer matrix laminates containing fibers parallel to the tensile loading direction (i.e., u ¼ 08),the tensile stress–strain curve islinear up to the point of failure (Figure 4.4). These specimens fail by tensile rupture of fibers, which is followed or accompanied by longitudinal splitting (debonding along the fiber–matrix interface) parallel to the fibers. This gives a typical broom-type appearance in the failed area of 08specimens(Figure 4.5a).For off-axisspecimens with 08 < u < 908,the tensile stress–strain curves may exhibit nonlinearity.For 908 specimens in which the fibers are 908 to the tensile loading direction, tensile rupture of the matrix or the fiber–matrix interface causes the ultimate failure. For intermediate angles, failure may occur by a combination of fiber–matrix interfacial shear failure, matrix shear failure, and matrix tensile rupture. For many of these off-axis specimens (including 908), matrix craze marks parallel to the fiber direction may appear throughout the gage length at low loads. Representative failure profiles for these specimens are shown in Figure 4.5b and c. Both tensile strength and modulus for unidirectional specimens depend strongly on the fiber orientation angle u (Figure 4.6). The maximum tensile strength and modulus are at u ¼ 08. With increasing fiber orientation angle, both tensile strength and modulus are reduced. The maximum reduction is observed near u ¼ 08 orientations. 2007 by Taylor & Francis Group, LLC.�