正在加载图片...

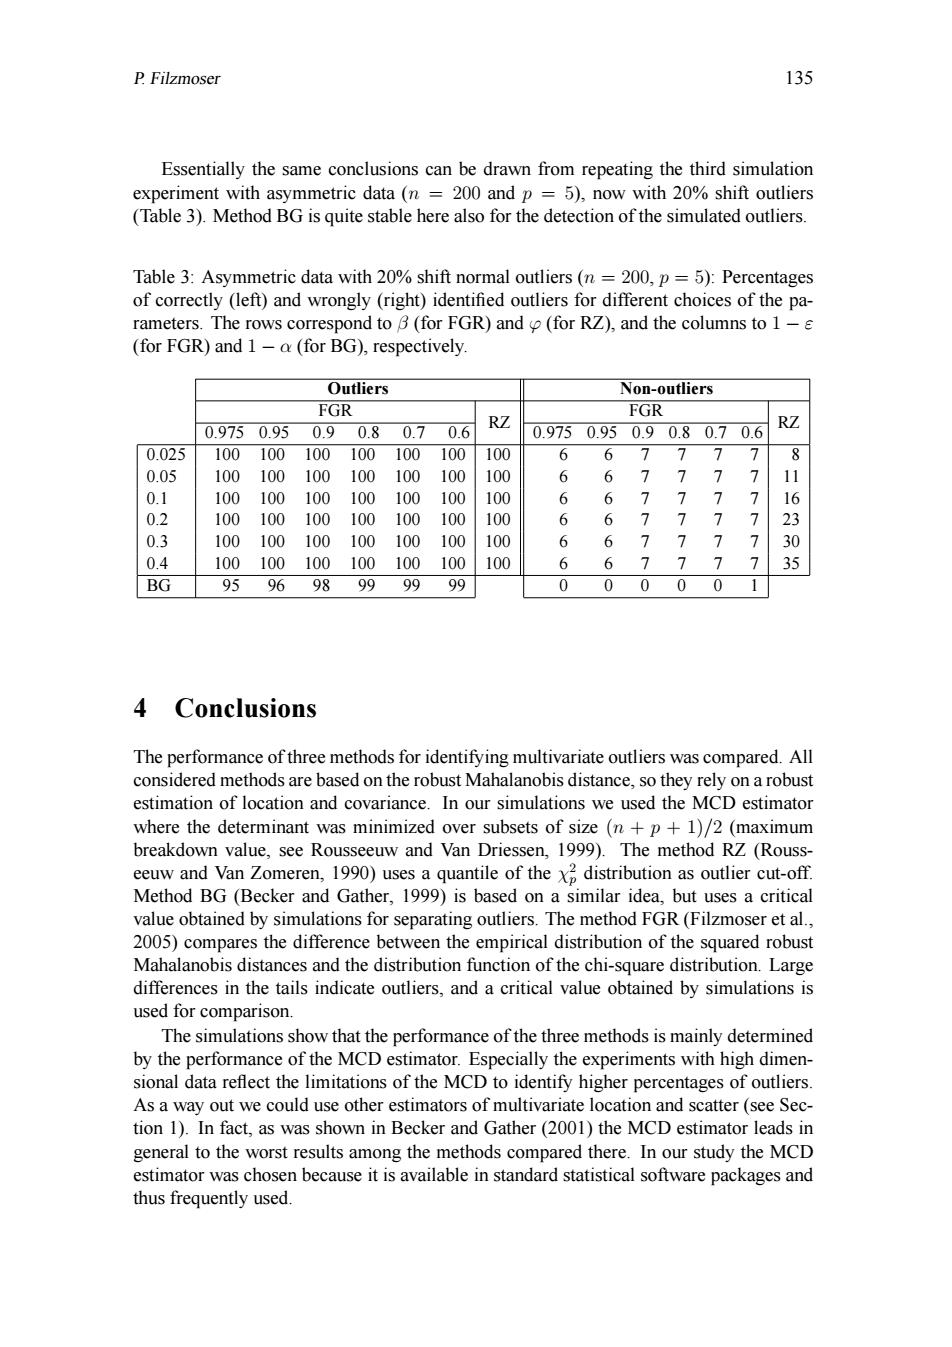
P.Filzmoser 135 Essentially the same conclusions can be drawn from repeating the third simulation experiment with asymmetric data(n =200 and p =5),now with 20%shift outliers (Table 3).Method BG is quite stable here also for the detection of the simulated outliers. Table 3:Asymmetric data with 20%shift normal outliers(n =200,p=5):Percentages of correctly (left)and wrongly(right)identified outliers for different choices of the pa- rameters.The rows correspond to B(for FGR)and (for RZ),and the columns to 1-s (for FGR)and 1-a(for BG),respectively Outliers Non-outliers FGR FGR 0.9750.950.90.80.70.6 RZ 0.9750.950.90.80.70.6 RZ 0.025 100100100100100100 100 6 6 77 7 7 8 0.05 100 100 100100 100 100 100 6 6 7 7 7 7 11 0.1 100 100 100 100 100 100 100 6 6 7 > 7 7 16 0.2 100 100 100 100 100 100 100 6 6 > > 7 23 0.3 100 100 100 100 100 100 100 6 6 > > 7 30 0.4 100 100 100100 100 100 100 6 6 > 7 35 BG 95 96 98 99 99 99 0 0 0 0 0 4 Conclusions The performance of three methods for identifying multivariate outliers was compared.All considered methods are based on the robust Mahalanobis distance,so they rely on a robust estimation of location and covariance.In our simulations we used the MCD estimator where the determinant was minimized over subsets of size(n+p+1)/2(maximum breakdown value,see Rousseeuw and Van Driessen,1999).The method RZ (Rouss eeuw and Van Zomeren,1990)uses a quantile of the x distribution as outlier cut-off. Method BG(Becker and Gather,1999)is based on a similar idea,but uses a critical value obtained by simulations for separating outliers.The method FGR(Filzmoser et al., 2005)compares the difference between the empirical distribution of the squared robust Mahalanobis distances and the distribution function of the chi-square distribution.Large differences in the tails indicate outliers,and a critical value obtained by simulations is used for comparison. The simulations show that the performance of the three methods is mainly determined by the performance of the MCD estimator.Especially the experiments with high dimen- sional data reflect the limitations of the MCD to identify higher percentages of outliers. As a way out we could use other estimators of multivariate location and scatter (see Sec- tion 1).In fact,as was shown in Becker and Gather(2001)the MCD estimator leads in general to the worst results among the methods compared there.In our study the MCD estimator was chosen because it is available in standard statistical software packages and thus frequently used.P. Filzmoser 135 Essentially the same conclusions can be drawn from repeating the third simulation experiment with asymmetric data (n = 200 and p = 5), now with 20% shift outliers (Table 3). Method BG is quite stable here also for the detection of the simulated outliers. Table 3: Asymmetric data with 20% shift normal outliers (n = 200, p = 5): Percentages of correctly (left) and wrongly (right) identified outliers for different choices of the parameters. The rows correspond to β (for FGR) and ϕ (for RZ), and the columns to 1 − ε (for FGR) and 1 − α (for BG), respectively. Outliers Non-outliers FGR RZ FGR RZ 0.975 0.95 0.9 0.8 0.7 0.6 0.975 0.95 0.9 0.8 0.7 0.6 0.025 100 100 100 100 100 100 100 6 6 7 7 7 7 8 0.05 100 100 100 100 100 100 100 6 6 7 7 7 7 11 0.1 100 100 100 100 100 100 100 6 6 7 7 7 7 16 0.2 100 100 100 100 100 100 100 6 6 7 7 7 7 23 0.3 100 100 100 100 100 100 100 6 6 7 7 7 7 30 0.4 100 100 100 100 100 100 100 6 6 7 7 7 7 35 BG 95 96 98 99 99 99 0 0 0 0 0 1 4 Conclusions The performance of three methods for identifying multivariate outliers was compared. All considered methods are based on the robust Mahalanobis distance, so they rely on a robust estimation of location and covariance. In our simulations we used the MCD estimator where the determinant was minimized over subsets of size (n + p + 1)/2 (maximum breakdown value, see Rousseeuw and Van Driessen, 1999). The method RZ (Rousseeuw and Van Zomeren, 1990) uses a quantile of the χ 2 p distribution as outlier cut-off. Method BG (Becker and Gather, 1999) is based on a similar idea, but uses a critical value obtained by simulations for separating outliers. The method FGR (Filzmoser et al., 2005) compares the difference between the empirical distribution of the squared robust Mahalanobis distances and the distribution function of the chi-square distribution. Large differences in the tails indicate outliers, and a critical value obtained by simulations is used for comparison. The simulations show that the performance of the three methods is mainly determined by the performance of the MCD estimator. Especially the experiments with high dimensional data reflect the limitations of the MCD to identify higher percentages of outliers. As a way out we could use other estimators of multivariate location and scatter (see Section 1). In fact, as was shown in Becker and Gather (2001) the MCD estimator leads in general to the worst results among the methods compared there. In our study the MCD estimator was chosen because it is available in standard statistical software packages and thus frequently used