正在加载图片...
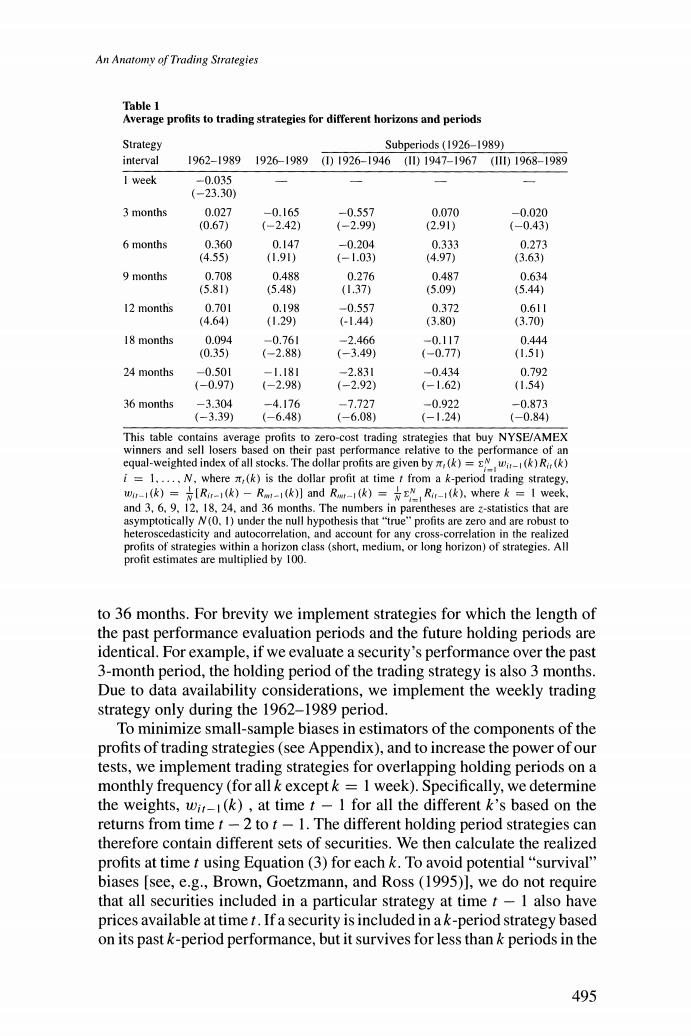
An Anatomy of Trading Strategies Table 1 Average profits to trading strategies for different horizons and periods Strategy Subperiods(1926-1989) interval 1962-19891926-1989 ()1926-1946(11)1947-1967(11)1968-1989 I week -0.035 (-23.30) 3 months 0.027 -0.165 -0.557 0.070 -0.020 (0.67) (-2.42) (-2.99) (2.91) (-0.43) 6 months 0.360 0.147 -0.204 0.333 0.273 (4.55) (1.91) (-1.03) (4.97) (3.63) 9 months 0.708 0.488 0.276 0.487 0.634 (5.81) (5.48) (I.37) (5.09) (5.44) 12 months 0.701 0.198 -0.557 0.372 0.611 (4.64) (1.29) (-1.44) (3.80) (3.70) 18 months 0.094 -0.761 -2.466 -0.117 0.444 (0.35) (-2.88) (-3.49) (-0.77) (1.51) 24 months -0.501 -1.181 -2.831 -0.434 0.792 (-0.97) (-2.98) (-2.92) (-1.62) (1.54) 36 months -3.304 -4.176 -7.727 -0.922 -0.873 (-3.39) (-6.48) -6.08) (-1.24) (-0.84) This table contains average profits to zero-cost trading strategies that buy NYSE/AMEX winners and sell losers based on their past performance relative to the performance of an equal-weighted index of all stocks.The dollar profits are given by (k)=w()R(k) i=1.....N,where (k)is the dollar profit at time t from a k-period trading strategy, war1(k)=[R-1(k)-Rm-1(k)]and Rw1(k)=Ri1(k).wherek I week. and 3,6.9.12.18.24.and 36 months.The numbers in parentheses are z-statistics that are asymptotically N(0.1)under the null hypothesis that"true"profits are zero and are robust to heteroscedasticity and autocorrelation,and account for any cross-correlation in the realized profits of strategies within a horizon class(short,medium.or long horizon)of strategies.All profit estimates are multiplied by 100. to 36 months.For brevity we implement strategies for which the length of the past performance evaluation periods and the future holding periods are identical.For example,if we evaluate a security's performance over the past 3-month period,the holding period of the trading strategy is also 3 months. Due to data availability considerations,we implement the weekly trading strategy only during the 1962-1989 period. To minimize small-sample biases in estimators of the components of the profits of trading strategies(see Appendix),and to increase the power of our tests,we implement trading strategies for overlapping holding periods on a monthly frequency(for all k exceptk I week).Specifically,we determine the weights,wir-1(k),at time t-I for all the different k's based on the returns from time t-2 to t-1.The different holding period strategies can therefore contain different sets of securities.We then calculate the realized profits at time t using Equation(3)for each k.To avoid potential"survival" biases [see,e.g.,Brown,Goetzmann,and Ross(1995)],we do not require that all securities included in a particular strategy at time t-I also have prices available at time t.If a security is included in ak-period strategy based on its past k-period performance,but it survives for less than k periods in the 495