正在加载图片...
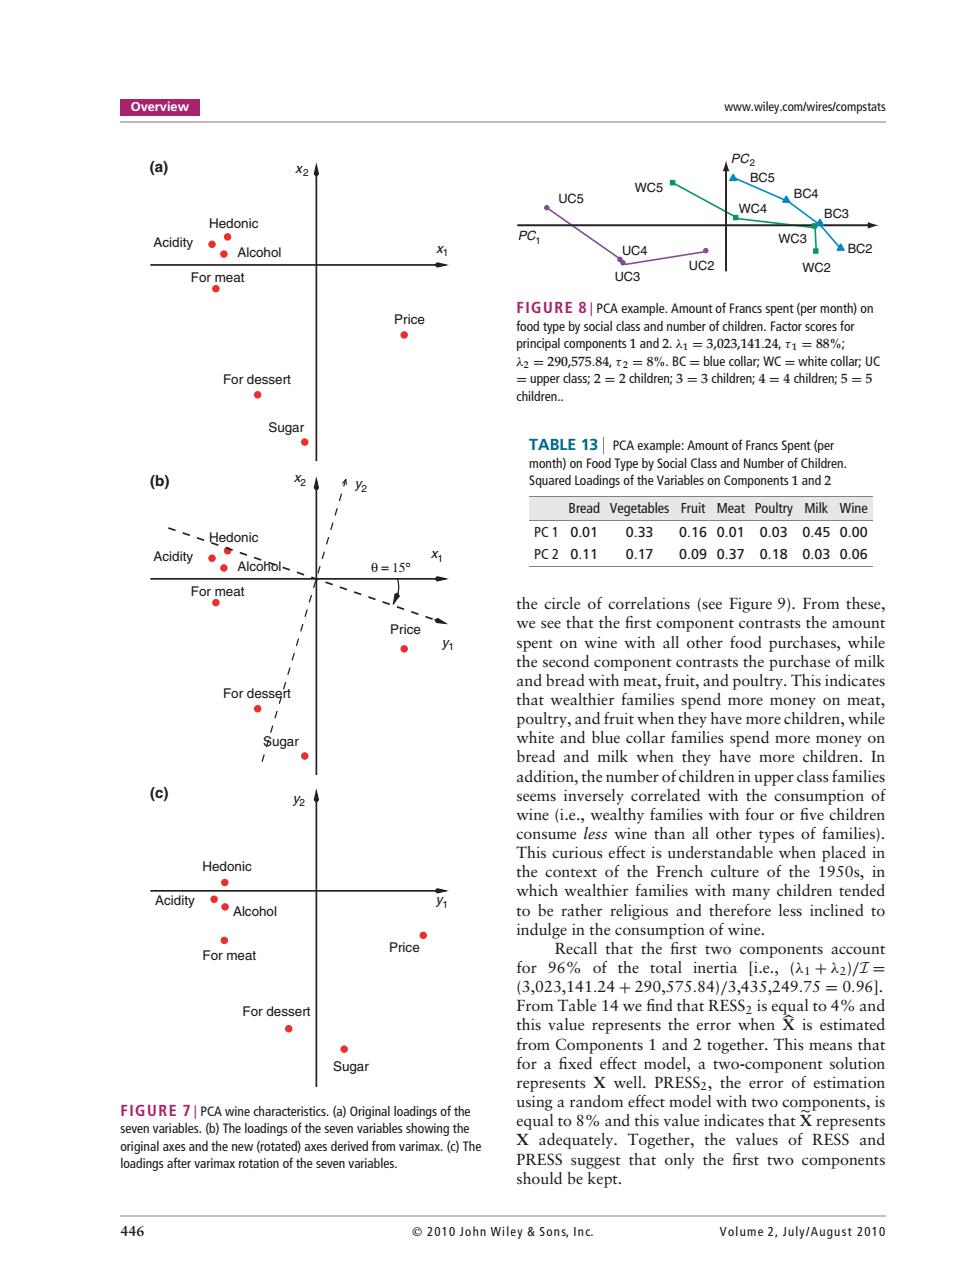
Overview www.wiley.com/wires/compstats (a) PC2 X24 WC5 ABC5 UC5 BC4 WC4 BC3 Hedonic Acidity PC WC3 ◆Alcohol UC4 盖BC2 UC2 WC2 For meat UC3 Price FIGURE 8|PCA example.Amount of Francs spent (per month)on food type by social class and number of children.Factor scores for principal components 1 and 2.=3,023,141.24,1 =88%; 2=290,575.84,2=8%.BC=blue collar;WC =white collar;UC For dessert upper class;2=2 children;3=3 children;4=4 children;5=5 children.. Sugar TABLE 13 PCA example:Amount of Francs Spent (per month)on Food Type by Social Class and Number of Children. (b) 2 y2 Squared Loadings of the Variables on Components 1 and 2 Bread Vegetables Fruit Meat Poultry Milk Wine ~~、Hedonic P℃10.010.330.160.010.030.450.00 Acidity·。Alcohol、-、 X1 PC20.110.170.090.370.180.030.06 0=15° For meat ● the circle of correlations(see Figure 9).From these, Price we see that the first component contrasts the amount spent on wine with all other food purchases,while the second component contrasts the purchase of milk and bread with meat,fruit,and poultry.This indicates For dessert ● that wealthier families spend more money on meat, poultry,and fruit when they have more children,while Sugar white and blue collar families spend more money on bread and milk when they have more children.In addition,the number of children in upper class families (c) seems inversely correlated with the consumption of wine(i.e.,wealthy families with four or five children consume less wine than all other types of families). This curious effect is understandable when placed in Hedonic the context of the French culture of the 1950s,in Acidity●。Alcohol which wealthier families with many children tended to be rather religious and therefore less inclined to indulge in the consumption of wine. For meat Price Recall that the first two components account for 96%of the total inertia [i.e.,(1+A2)/T= (3,023,141.24+290,575.84)/3,435,249.75=0.96. For dessert From Table 14 we find that RESS2 is equal to 4%and this value represents the error when X is estimated from Components 1 and 2 together.This means that Sugar for a fixed effect model,a two-component solution represents X well.PRESS2,the error of estimation FIGURE 7 PCA wine characteristics.(a)Original loadings of the using a random effect model with two components,is seven variables.(b)The loadings of the seven variables showing the equal to 8%and this value indicates that X represents original axes and the new (rotated)axes derived from varimax.(c)The X adequately.Together,the values of RESS and loadings after varimax rotation of the seven variables. PRESS suggest that only the first two components should be kept. 446 2010 John Wiley Sons,Inc. Volume 2,July/August 2010Overview www.wiley.com/wires/compstats x1 Hedonic Acidity Alcohol For meat For dessert Sugar Price x2 y1 x1 Hedonic Acidity Alcohol For meat For dessert Sugar Price θ = 15° y2 x2 y1 Hedonic For meat Acidity Alcohol Sugar For dessert Price y2 (a) (b) (c) FIGURE 7 | PCA wine characteristics. (a) Original loadings of the seven variables. (b) The loadings of the seven variables showing the original axes and the new (rotated) axes derived from varimax. (c) The loadings after varimax rotation of the seven variables. BC2 BC3 BC4 BC5 WC2 WC3 WC4 WC5 UC2 UC3 UC4 UC5 PC1 PC2 FIGURE 8 | PCA example. Amount of Francs spent (per month) on food type by social class and number of children. Factor scores for principal components 1 and 2. λ1 = 3,023,141.24, τ 1 = 88%; λ2 = 290,575.84, τ 2 = 8%. BC = blue collar; WC = white collar; UC = upper class; 2 = 2 children; 3 = 3 children; 4 = 4 children; 5 = 5 children.. TABLE 13 PCA example: Amount of Francs Spent (per month) on Food Type by Social Class and Number of Children. Squared Loadings of the Variables on Components 1 and 2 Bread Vegetables Fruit Meat Poultry Milk Wine PC 1 0.01 0.33 0.16 0.01 0.03 0.45 0.00 PC 2 0.11 0.17 0.09 0.37 0.18 0.03 0.06 the circle of correlations (see Figure 9). From these, we see that the first component contrasts the amount spent on wine with all other food purchases, while the second component contrasts the purchase of milk and bread with meat, fruit, and poultry. This indicates that wealthier families spend more money on meat, poultry, and fruit when they have more children, while white and blue collar families spend more money on bread and milk when they have more children. In addition, the number of children in upper class families seems inversely correlated with the consumption of wine (i.e., wealthy families with four or five children consume less wine than all other types of families). This curious effect is understandable when placed in the context of the French culture of the 1950s, in which wealthier families with many children tended to be rather religious and therefore less inclined to indulge in the consumption of wine. Recall that the first two components account for 96% of the total inertia [i.e., (λ1 + λ2)/I = (3,023,141.24 + 290,575.84)/3,435,249.75 = 0.96]. From Table 14 we find that RESS2 is equal to 4% and this value represents the error when X+ is estimated from Components 1 and 2 together. This means that for a fixed effect model, a two-component solution represents X well. PRESS2, the error of estimation using a random effect model with two components, is equal to 8% and this value indicates that X. represents X adequately. Together, the values of RESS and PRESS suggest that only the first two components should be kept. 446 2010 John Wiley & Son s, In c. Volume 2, July/Augu st 2010