正在加载图片...
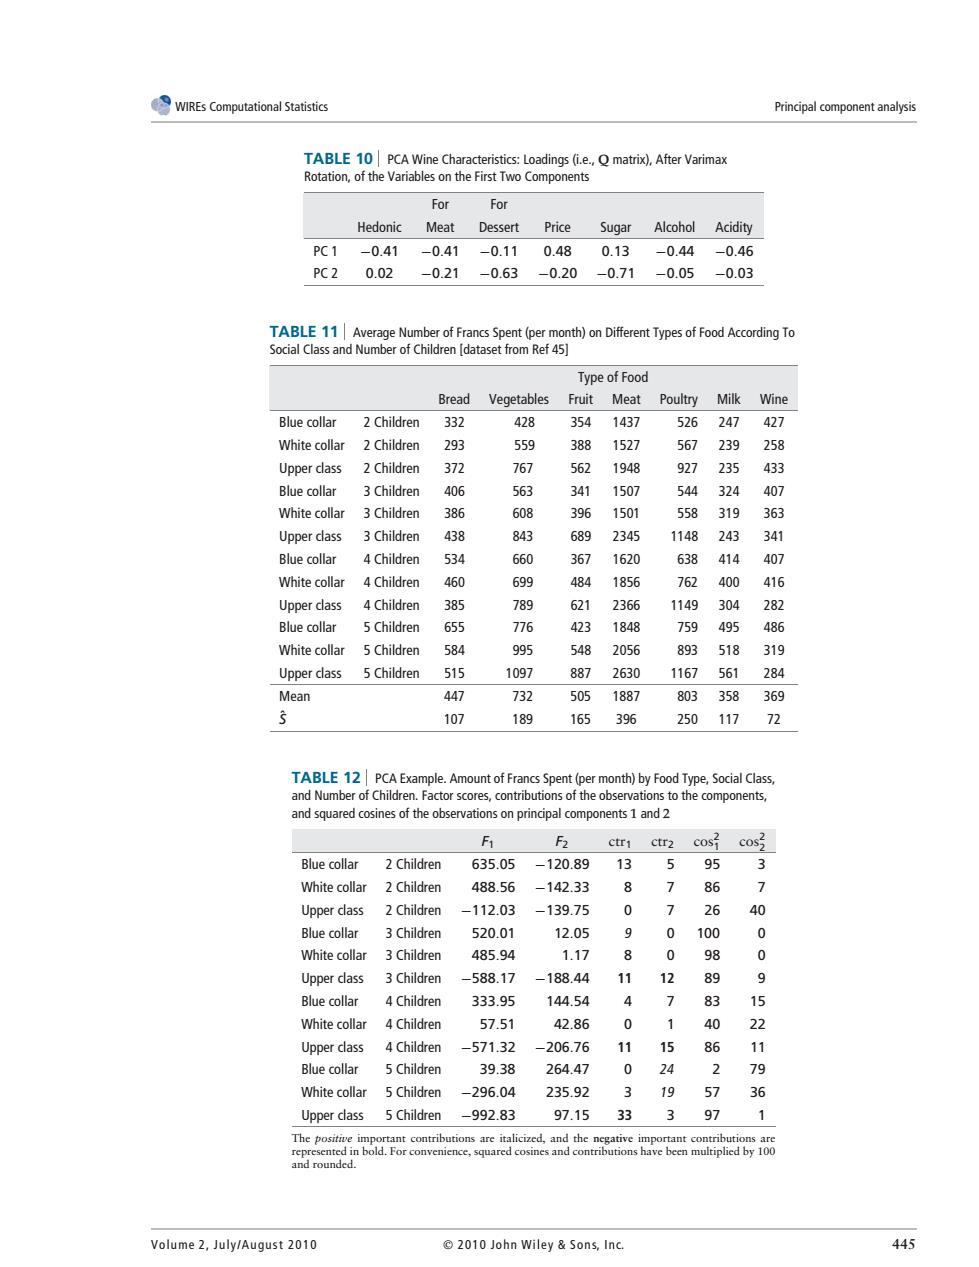
WIREs Computational Statistics Principal component analysis TABLE 10 PCA Wine Characteristics:Loadings (i.e.,Q matrix),After Varimax Rotation,of the Variables on the First Two Components For For Hedonic Meat Dessert Price Sugar Alcohol Acidity PC1 -0.41 -0.41 -0.11 0.48 0.13 -0.44 -0.46 PC2 0.02 -0.21 -0.63 -0.20 -0.71 -0.05 -0.03 TABLE 11 Average Number of Francs Spent(per month)on Different Types of Food According To Social Class and Number of Children [dataset from Ref 45] Type of Food Bread Vegetables Fruit Meat Poultry Milk Wine Blue collar 2 Children 332 428 354 1437 526 247 427 White collar 2 Children 293 559 388 1527 567 239 258 Upper class 2 Children 372 767 562 1948 927 235 433 Blue collar 3 Children 406 563 341 1507 544 324 407 White collar 3 Children 386 608 396 1501 558 319 363 Upper class 3 Children 438 843 689 2345 1148 243 341 Blue collar 4 Children 534 660 367 1620 638 414 407 White collar 4 Children 460 699 484 1856 762 400 416 Upper class 4 Children 385 789 621 2366 1149 304 282 Blue collar 5 Children 655 776 423 1848 759 495 486 White collar 5 Children 584 995 548 2056 893 518 319 Upper class 5 Children 515 1097 887 2630 1167 561 284 Mean 447 732 505 1887 803 358 369 107 189 165 396 250 117 72 TABLE 12 PCA Example.Amount of Francs Spent (per month)by Food Type,Social Class, and Number of Children.Factor scores,contributions of the observations to the components, and squared cosines of the observations on principal components 1 and 2 F F ctr1 ctr2 cos2 Blue collar 2 Children 635.05 120.89 13 5 95 3 White collar 2 Children 488.56 -142.33 P 86 Upper class 2 Children -112.03 -139.75 0 7 26 40 Blue collar 3 Children 520.01 12.05 9 0 100 0 White collar 3 Children 485.94 1.17 P 0 98 0 Upper class 3Children -588.17 -188.44 11 12 89 9 Blue collar 4 Children 333.95 144.54 4 7 83 15 White collar 4 Children 57.51 42.86 0 1 40 22 Upper class 4 Children -571.32 -206.76 11 15 86 11 Blue collar 5Children 39.38 264.47 0 24 2 79 White collar 5 Children -296.04 235.92 19 57 36 Upper class 5 Children -992.83 97.15 33 3 97 1 The positive important contributions are italicized,and the negative important contributions are represented in bold.For convenience,squared cosines and contributions have been multiplied by 100 and rounded. Volume 2,July/August 2010 2010 John Wiley Sons,Inc. 445WIREs Computational Statistics Principal component analysis TABLE 10 PCA Wine Characteristics: Loadings (i.e., Q matrix), After Varimax Rotation, of the Variables on the First Two Components For For Hedonic Meat Dessert Price Sugar Alcohol Acidity PC 1 −0.41 −0.41 −0.11 0.48 0.13 −0.44 −0.46 PC 2 0.02 −0.21 −0.63 −0.20 −0.71 −0.05 −0.03 TABLE 11 Average Number of Francs Spent (per month) on Different Types of Food According To Social Class and Number of Children [dataset from Ref 45] Type of Food Bread Vegetables Fruit Meat Poultry Milk Wine Blue collar 2 Children 332 428 354 1437 526 247 427 White collar 2 Children 293 559 388 1527 567 239 258 Upper class 2 Children 372 767 562 1948 927 235 433 Blue collar 3 Children 406 563 341 1507 544 324 407 White collar 3 Children 386 608 396 1501 558 319 363 Upper class 3 Children 438 843 689 2345 1148 243 341 Blue collar 4 Children 534 660 367 1620 638 414 407 White collar 4 Children 460 699 484 1856 762 400 416 Upper class 4 Children 385 789 621 2366 1149 304 282 Blue collar 5 Children 655 776 423 1848 759 495 486 White collar 5 Children 584 995 548 2056 893 518 319 Upper class 5 Children 515 1097 887 2630 1167 561 284 Mean 447 732 505 1887 803 358 369 Sˆ 107 189 165 396 250 117 72 TABLE 12 PCA Example. Amount of Francs Spent (per month) by Food Type, Social Class, and Number of Children. Factor scores, contributions of the observations to the components, and squared cosines of the observations on principal components 1 and 2 F1 F2 ctr1 ctr2 cos2 1 cos2 2 Blue collar 2 Children 635.05 −120.89 13 5 95 3 White collar 2 Children 488.56 −142.33 8 7 86 7 Upper class 2 Children −112.03 −139.75 0 7 26 40 Blue collar 3 Children 520.01 12.05 9 0 100 0 White collar 3 Children 485.94 1.17 8 0 98 0 Upper class 3 Children −588.17 −188.44 11 12 89 9 Blue collar 4 Children 333.95 144.54 4 7 83 15 White collar 4 Children 57.51 42.86 0 1 40 22 Upper class 4 Children −571.32 −206.76 11 15 86 11 Blue collar 5 Children 39.38 264.47 0 24 2 79 White collar 5 Children −296.04 235.92 3 19 57 36 Upper class 5 Children −992.83 97.15 33 3 97 1 The positive important contributions are italicized, and the negative important contributions are represented in bold. For convenience, squared cosines and contributions have been multiplied by 100 and rounded. Volume 2, July/August 2010 2010 John Wiley & Son s, In c. 445