正在加载图片...
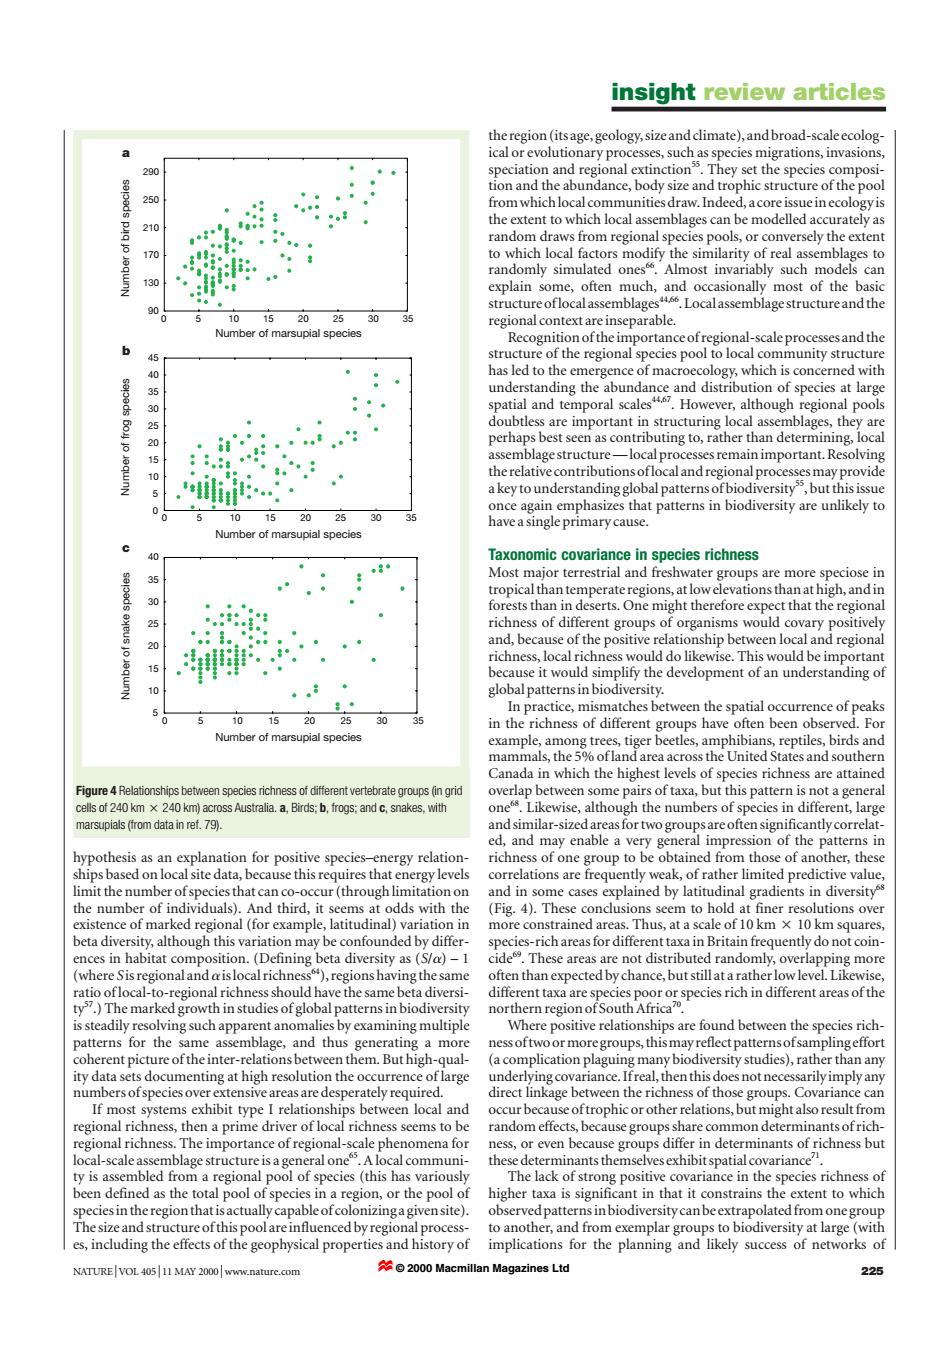
insight review articles the region (its age,geology,size and climate),and broad-scale ecolog ical or evolutionary processes,such as species migrations,invasions, 290 speciation and regional extinction They set the species composi- tion and the abundance,body size and trophic structure of the pool 250 from whichlocal communities draw.Indeed,a core issue in ecology is 210 the extent to which local assemblages can be modelled accurately as random draws from regional species pools,or conversely the extent 170 to which local factors modify the similarity of real assemblages to randomly simulated ones Almost invariably such models can 130 explain some,often much,and occasionally most of the basic structureoflocalassemblages4.Localassemblagestructureand the 5 10 15 20 25 30 regional context are inseparable. Number of marsupial specie Recognition of the importance ofregional-scale processes and the structure of the regional species pool to local community structure 40 has led to the emergence of macroecology,which is concerned with understanding the abundance and distribution of species at large spatial and temporal scales4.However,although regional pools doubtless are important in structuring local assemblages,they are perhaps best seen as contributing to,rather than determining,local assemblage structure-local processes remain important.Resolving 0 the relative contributions oflocal and regional processes may provide a key to understanding global patterns ofbiodiversity,but this issue once again emphasizes that patterns in biodiversity are unlikely to 10 20 25 30 have a single primary cause. Number of marsupial species Taxonomic covariance in species richness Most major terrestrial and freshwater groups are more speciose in tropical than temperate regions,at low elevations than at high,and in forests than in deserts.One might therefore expect that the regional richness of different groups of organisms would covary positively 20 and,because of the positive relationship between local and regional richness,local richness would do likewise.This would be important because it would simplify the development of an understanding of globalpatterns in biodiversity. In practice,mismatches between the spatial occurrence of peaks 10 in the richness of different groups have often been observed.For Number of marsuoial species example,among trees,tiger beetles,amphibians,reptiles,birds and mammals,the 5%ofland area across the United States and southern Canada in which the highest levels of species richness are attained Figure 4 Relationships between species richness of different vertebrate groups(in grid overlap between some pairs of taxa,but this pattern is not a general cells of 240 km x 240 km)across Australia.a,Birds:b,frogs:and c,snakes,with one.Likewise,although the numbers of species in different,large marsupials (from data in ref.79). and similar-sized areas for two groups are often significantly correlat- ed,and may enable a very general impression of the patterns in hypothesis as an explanation for positive species-energy relation- richness of one group to be obtained from those of another,these ships based on local site data,because this requires that energy levels correlations are frequently weak,of rather limited predictive value, limit the number of species that can co-occur(through limitation on and in some cases explained by latitudinal gradients in diversity s the number of individuals).And third,it seems at odds with the (Fig.4).These conclusions seem to hold at finer resolutions over existence of marked regional (for example,latitudinal)variation in more constrained areas.Thus,at a scale of 10 km x 10 km squares beta diversity,although this variation may be confounded by differ- species-rich areas for different taxa in Britain frequently do not coin- ences in habitat composition.(Defining beta diversity as (S/a)-1 cide.These areas are not distributed randomly,overlapping more (where Sisregionalandaislocalrichness),regionshaving the same often than expected by chance,but still at a rather low level.Likewise, ratio oflocal-to-regional richness should have the same beta diversi- different taxa are species poor or species rich in different areas of the ty.)The marked growth in studies of global patterns in biodiversity northern region ofSouth Africa?0 is steadily resolving such apparent anomalies by examining multiple Where positive relationships are found between the species rich- patterns for the same assemblage,and thus generating a more ness oftwo or more groups,this may reflect patterns ofsamplingeffort coherent picture of the inter-relations between them.But high-qual- (a complication plaguing many biodiversity studies),rather than any ity data sets documenting at high resolution the occurrence of large underlying covariance.Ifreal,then this does not necessarily imply any numbers ofspecies over extensive areas are desperately required. direct linkage between the richness of those groups.Covariance can If most systems exhibit type I relationships between local and occur because oftrophic or other relations,but might also result from regional richness,then a prime driver of local richness seems to be random effects,because groups share common determinants of rich- regional richness.The importance of regional-scale phenomena for ness,or even because groups differ in determinants of richness but local-scale assemblage structure is a general one.A local communi- these determinants themselves exhibit spatial covariance ty is assembled from a regional pool of species (this has variously The lack of strong positive covariance in the species richness of been defined as the total pool of species in a region,or the pool of higher taxa is significant in that it constrains the extent to which species in the region that is actually capable ofcolonizinga given site). observed patterns in biodiversity can be extrapolated from one group The size and structure ofthis pool are influenced by regional process- to another,and from exemplar groups to biodiversity at large(with es,including the effects of the geophysical properties and history of implications for the planning and likely success of networks of NATURE|VOL 40511 MAY 2000 www.nature.com ☆©2000 Macmillan Magazines Ltd 225hypothesis as an explanation for positive species–energy relationships based on local site data, because this requires that energy levels limit the number of species that can co-occur (through limitation on the number of individuals). And third, it seems at odds with the existence of marked regional (for example, latitudinal) variation in beta diversity, although this variation may be confounded by differences in habitat composition. (Defining beta diversity as (S/a) – 1 (where S is regional and ais local richness64), regions having the same ratio of local-to-regional richness should have the same beta diversity57.) The marked growth in studies of global patterns in biodiversity is steadily resolving such apparent anomalies by examining multiple patterns for the same assemblage, and thus generating a more coherent picture of the inter-relations between them. But high-quality data sets documenting at high resolution the occurrence of large numbers of species over extensive areas are desperately required. If most systems exhibit type I relationships between local and regional richness, then a prime driver of local richness seems to be regional richness. The importance of regional-scale phenomena for local-scale assemblage structure is a general one65. A local community is assembled from a regional pool of species (this has variously been defined as the total pool of species in a region, or the pool of species in the region that is actually capable of colonizing a given site). The size and structure of this pool are influenced by regional processes, including the effects of the geophysical properties and history of the region (its age, geology, size and climate), and broad-scale ecological or evolutionary processes, such as species migrations, invasions, speciation and regional extinction55. They set the species composition and the abundance, body size and trophic structure of the pool from which local communities draw. Indeed, a core issue in ecology is the extent to which local assemblages can be modelled accurately as random draws from regional species pools, or conversely the extent to which local factors modify the similarity of real assemblages to randomly simulated ones66. Almost invariably such models can explain some, often much, and occasionally most of the basic structure of local assemblages44,66. Local assemblage structure and the regional context are inseparable. Recognition of the importance of regional-scale processes and the structure of the regional species pool to local community structure has led to the emergence of macroecology, which is concerned with understanding the abundance and distribution of species at large spatial and temporal scales44,67. However, although regional pools doubtless are important in structuring local assemblages, they are perhaps best seen as contributing to, rather than determining, local assemblage structure — local processes remain important. Resolving the relative contributions of local and regional processes may provide a key to understanding global patterns of biodiversity55, but this issue once again emphasizes that patterns in biodiversity are unlikely to have a single primary cause. Taxonomic covariance in species richness Most major terrestrial and freshwater groups are more speciose in tropical than temperate regions, at low elevations than at high, and in forests than in deserts. One might therefore expect that the regional richness of different groups of organisms would covary positively and, because of the positive relationship between local and regional richness, local richness would do likewise. This would be important because it would simplify the development of an understanding of global patterns in biodiversity. In practice, mismatches between the spatial occurrence of peaks in the richness of different groups have often been observed. For example, among trees, tiger beetles, amphibians, reptiles, birds and mammals, the 5% of land area across the United States and southern Canada in which the highest levels of species richness are attained overlap between some pairs of taxa, but this pattern is not a general one68. Likewise, although the numbers of species in different, large and similar-sized areas for two groups are often significantly correlated, and may enable a very general impression of the patterns in richness of one group to be obtained from those of another, these correlations are frequently weak, of rather limited predictive value, and in some cases explained by latitudinal gradients in diversity68 (Fig. 4). These conclusions seem to hold at finer resolutions over more constrained areas. Thus, at a scale of 10 km 2 10 km squares, species-rich areas for different taxa in Britain frequently do not coincide69. These areas are not distributed randomly, overlapping more often than expected by chance, but still at a rather low level. Likewise, different taxa are species poor or species rich in different areas of the northern region of South Africa70. Where positive relationships are found between the species richness of two or more groups, this may reflect patterns of sampling effort (a complication plaguing many biodiversity studies), rather than any underlying covariance. If real, then this does not necessarily imply any direct linkage between the richness of those groups. Covariance can occur because of trophic or other relations, but might also result from random effects, because groups share common determinants of richness, or even because groups differ in determinants of richness but these determinants themselves exhibit spatial covariance71. The lack of strong positive covariance in the species richness of higher taxa is significant in that it constrains the extent to which observed patterns in biodiversity can be extrapolated from one group to another, and from exemplar groups to biodiversity at large (with implications for the planning and likely success of networks of insight review articles NATURE | VOL 405 | 11 MAY 2000 | www.nature.com 225 90 130 170 210 250 290 0 5 10 15 20 25 30 35 Number of frog species Number of bird species 0 5 10 15 20 25 30 35 40 45 0 5 10 15 20 25 30 35 Number of snake species 5 10 15 20 25 30 35 40 0 5 10 15 20 25 30 35 Number of marsupial species Number of marsupial species Number of marsupial species a b c Figure 4 Relationships between species richness of different vertebrate groups (in grid cells of 240 km 2 240 km) across Australia. a, Birds; b, frogs; and c, snakes, with marsupials (from data in ref. 79). © 2000 Macmillan Magazines Ltd