正在加载图片...

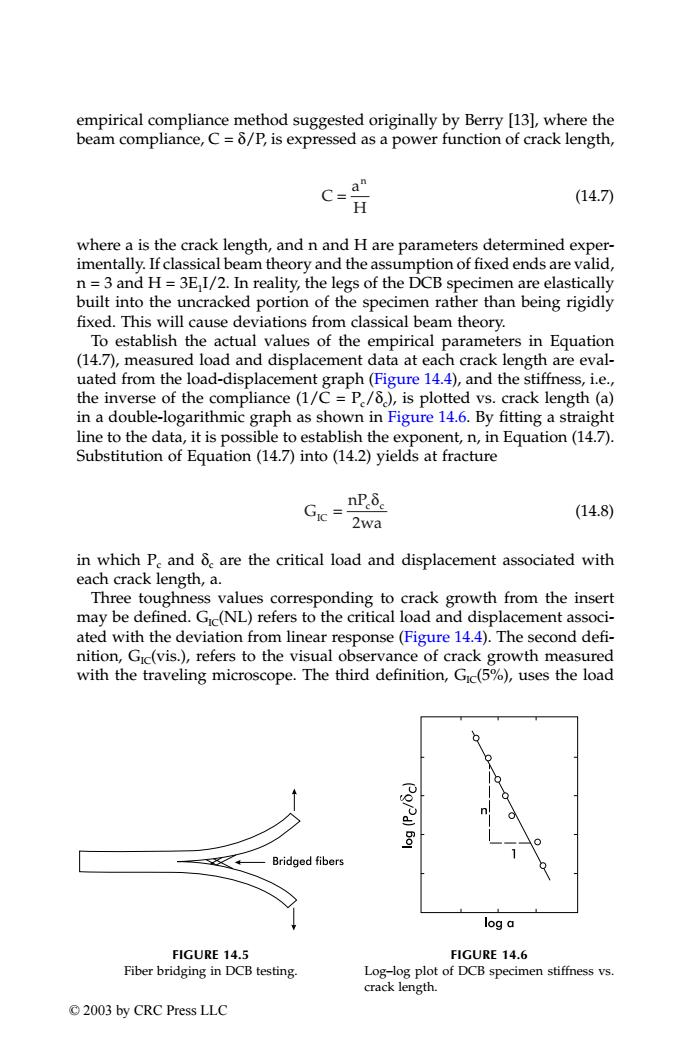
empirical compliance method suggested originally by Berry [13],where the beam compliance,C=8/P,is expressed as a power function of crack length, C=a (14.7) H where a is the crack length,and n and H are parameters determined exper- imentally.If classical beam theory and the assumption of fixed ends are valid, n=3 and H=3E I/2.In reality,the legs of the DCB specimen are elastically built into the uncracked portion of the specimen rather than being rigidly fixed.This will cause deviations from classical beam theory. To establish the actual values of the empirical parameters in Equation (14.7),measured load and displacement data at each crack length are eval- uated from the load-displacement graph(Figure 14.4),and the stiffness,i.e., the inverse of the compliance(1/C=P/8),is plotted vs.crack length(a) in a double-logarithmic graph as shown in Figure 14.6.By fitting a straight line to the data,it is possible to establish the exponent,n,in Equation(14.7). Substitution of Equation (14.7)into (14.2)yields at fracture nPδe (14.8) 2wa in which P.and 8.are the critical load and displacement associated with each crack length,a. Three toughness values corresponding to crack growth from the insert may be defined.Gic(NL)refers to the critical load and displacement associ- ated with the deviation from linear response(Figure 14.4).The second defi- nition,Gic(vis.),refers to the visual observance of crack growth measured with the traveling microscope.The third definition,Gic(5%),uses the load PoPd)5o1 Bridged fibers log a FIGURE 14.5 FIGURE 14.6 Fiber bridging in DCB testing. Log-log plot of DCB specimen stiffness vs. crack length. ©2003 by CRC Press LLCempirical compliance method suggested originally by Berry [13], where the beam compliance, C = δ/P, is expressed as a power function of crack length, (14.7) where a is the crack length, and n and H are parameters determined experimentally. If classical beam theory and the assumption of fixed ends are valid, n = 3 and H = 3E1I/2. In reality, the legs of the DCB specimen are elastically built into the uncracked portion of the specimen rather than being rigidly fixed. This will cause deviations from classical beam theory. To establish the actual values of the empirical parameters in Equation (14.7), measured load and displacement data at each crack length are evaluated from the load-displacement graph (Figure 14.4), and the stiffness, i.e., the inverse of the compliance (1/C = Pc/δc), is plotted vs. crack length (a) in a double-logarithmic graph as shown in Figure 14.6. By fitting a straight line to the data, it is possible to establish the exponent, n, in Equation (14.7). Substitution of Equation (14.7) into (14.2) yields at fracture (14.8) in which Pc and δc are the critical load and displacement associated with each crack length, a. Three toughness values corresponding to crack growth from the insert may be defined. GIC(NL) refers to the critical load and displacement associated with the deviation from linear response (Figure 14.4). The second defi- nition, GIC(vis.), refers to the visual observance of crack growth measured with the traveling microscope. The third definition, GIC(5%), uses the load FIGURE 14.5 Fiber bridging in DCB testing. FIGURE 14.6 Log–log plot of DCB specimen stiffness vs. crack length. C a H n = G nP wa IC c c = δ 2 TX001_ch14_Frame Page 190 Saturday, September 21, 2002 5:09 AM © 2003 by CRC Press LLC