正在加载图片...

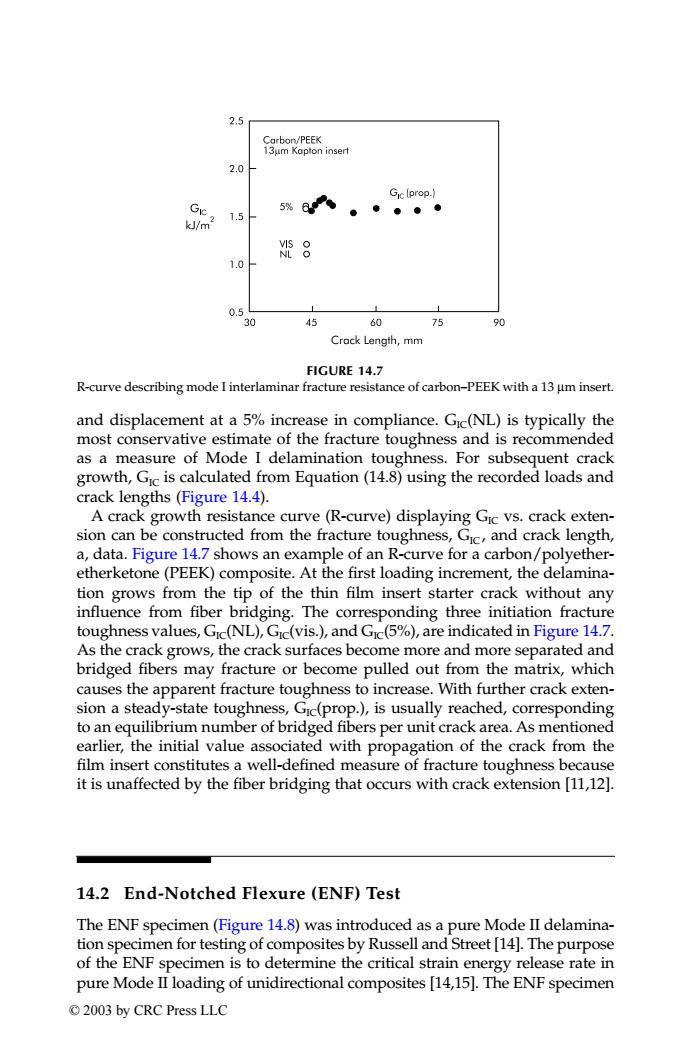
2.5 Carbon/PEEK 13μm Kopton insert 2.0 Gic [prop.) Gic 5%a ● m2 1.5 邓8 1.0 0.5 30 45 60 75 90 Crack Length,mm FIGURE 14.7 R-curve describing mode I interlaminar fracture resistance of carbon-PEEK with a 13 um insert. and displacement at a 5%increase in compliance.Gic(NL)is typically the most conservative estimate of the fracture toughness and is recommended as a measure of Mode I delamination toughness.For subsequent crack growth,Gic is calculated from Equation(14.8)using the recorded loads and crack lengths (Figure 14.4). A crack growth resistance curve (R-curve)displaying Gic vs.crack exten- sion can be constructed from the fracture toughness,Gic,and crack length, a,data.Figure 14.7 shows an example of an R-curve for a carbon/polyether- etherketone(PEEK)composite.At the first loading increment,the delamina- tion grows from the tip of the thin film insert starter crack without any influence from fiber bridging.The corresponding three initiation fracture toughness values,Gic(NL),Gic(vis.),and Gic(5%),are indicated in Figure 14.7. As the crack grows,the crack surfaces become more and more separated and bridged fibers may fracture or become pulled out from the matrix,which causes the apparent fracture toughness to increase.With further crack exten- sion a steady-state toughness,Gic(prop.),is usually reached,corresponding to an equilibrium number of bridged fibers per unit crack area.As mentioned earlier,the initial value associated with propagation of the crack from the film insert constitutes a well-defined measure of fracture toughness because it is unaffected by the fiber bridging that occurs with crack extension [11,12]. 14.2 End-Notched Flexure(ENF)Test The ENF specimen(Figure 14.8)was introduced as a pure Mode II delamina- tion specimen for testing of composites by Russell and Street [14].The purpose of the ENF specimen is to determine the critical strain energy release rate in pure Mode II loading of unidirectional composites [14,15].The ENF specimen ©2003 by CRC Press LLCand displacement at a 5% increase in compliance. GIC(NL) is typically the most conservative estimate of the fracture toughness and is recommended as a measure of Mode I delamination toughness. For subsequent crack growth, GIC is calculated from Equation (14.8) using the recorded loads and crack lengths (Figure 14.4). A crack growth resistance curve (R-curve) displaying GIC vs. crack extension can be constructed from the fracture toughness, GIC , and crack length, a, data. Figure 14.7 shows an example of an R-curve for a carbon/polyetheretherketone (PEEK) composite. At the first loading increment, the delamination grows from the tip of the thin film insert starter crack without any influence from fiber bridging. The corresponding three initiation fracture toughness values, GIC(NL), GIC(vis.), and GIC(5%), are indicated in Figure 14.7. As the crack grows, the crack surfaces become more and more separated and bridged fibers may fracture or become pulled out from the matrix, which causes the apparent fracture toughness to increase. With further crack extension a steady-state toughness, GIC(prop.), is usually reached, corresponding to an equilibrium number of bridged fibers per unit crack area. As mentioned earlier, the initial value associated with propagation of the crack from the film insert constitutes a well-defined measure of fracture toughness because it is unaffected by the fiber bridging that occurs with crack extension [11,12]. 14.2 End-Notched Flexure (ENF) Test The ENF specimen (Figure 14.8) was introduced as a pure Mode II delamination specimen for testing of composites by Russell and Street [14]. The purpose of the ENF specimen is to determine the critical strain energy release rate in pure Mode II loading of unidirectional composites [14,15]. The ENF specimen FIGURE 14.7 R-curve describing mode I interlaminar fracture resistance of carbon–PEEK with a 13 µm insert. TX001_ch14_Frame Page 191 Saturday, September 21, 2002 5:09 AM © 2003 by CRC Press LLC