正在加载图片...

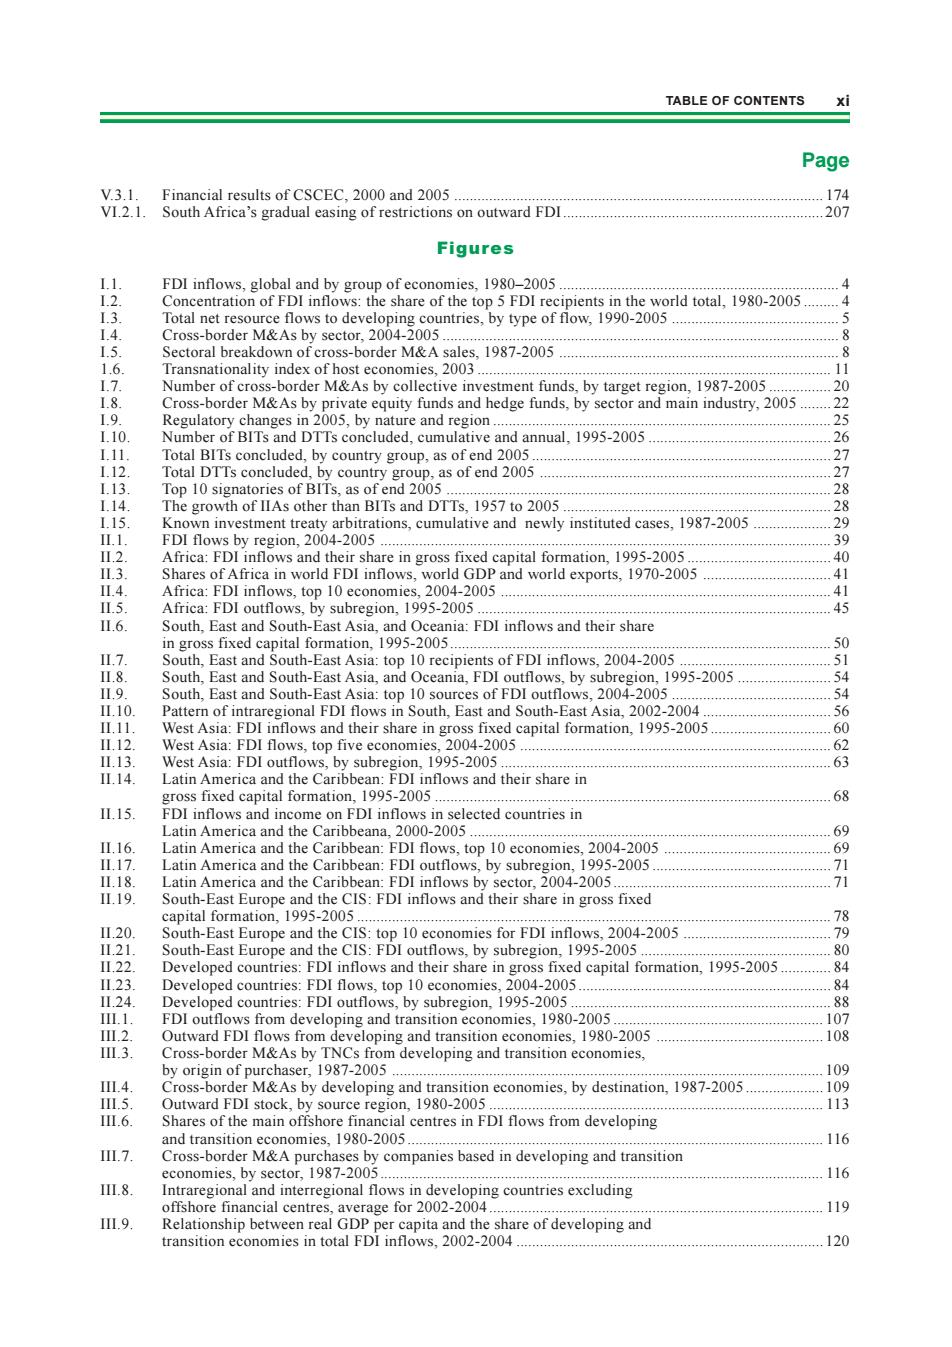
TABLE OF CONTENTS XI Page easing of restrictions on outward FDI 201 Figures Total net resou M&As b 0 by nur and region y instituted cases,1987-00 话8990445 outh 004-20 1995-2005 0420 on South East and Souh-EastAs 42002-2004 A Icapital formation. 01446066 115 selected countries in 68 ton 10 e nomies,.2004-200 89 042005 200 cres and品anecto tal form heir share in gross fixed ,2004-200 East m5-005 08 d co and tran 190-200 TNCs fro sby developi and by destination. 7 M&Ap叫 116 banies hased in develoning and transition m.8 al and ints 116 119 l.9 Relationship be ransition eco nomies in total D 120TABLE OF CONTENTS xi V.3.1. Financial results of CSCEC, 2000 and 2005 ............................................................................................... 174 VI.2.1. South Africa’s gradual easing of restrictions on outward FDI................................................................... 207
I.1. FDI inflows, global and by group of economies, 1980–2005 ........................................................................ 4 I.2. Concentration of FDI inflows: the share of the top 5 FDI recipients in the world total, 1980-2005 ......... 4 I.3. Total net resource flows to developing countries, by type of flow, 1990-2005 ........................................... 5 I.4. Cross-border M&As by sector, 2004-2005 ...................................................................................................... 8 I.5. Sectoral breakdown of cross-border M&A sales, 1987-2005 ........................................................................ 8 1.6. Transnationality index of host economies, 2003 ........................................................................................... 11 I.7. Number of cross-border M&As by collective investment funds, by target region, 1987-2005 ................ 20 I.8. Cross-border M&As by private equity funds and hedge funds, by sector and main industry, 2005 ........ 22 I.9. Regulatory changes in 2005, by nature and region ....................................................................................... 25 I.10. Number of BITs and DTTs concluded, cumulative and annual, 1995-2005 ............................................... 26 I.11. Total BITs concluded, by country group, as of end 2005 ............................................................................. 27 I.12. Total DTTs concluded, by country group, as of end 2005 ........................................................................... 27 I.13. Top 10 signatories of BITs, as of end 2005 ................................................................................................... 28 I.14. The growth of IIAs other than BITs and DTTs, 1957 to 2005 ..................................................................... 28 I.15. Known investment treaty arbitrations, cumulative and newly instituted cases, 1987-2005 .................... 29 II.1. FDI flows by region, 2004-2005 .................................................................................................................... 39 II.2. Africa: FDI inflows and their share in gross fixed capital formation, 1995-2005 ..................................... 40 II.3. Shares of Africa in world FDI inflows, world GDP and world exports, 1970-2005 ................................. 41 II.4. Africa: FDI inflows, top 10 economies, 2004-2005 ..................................................................................... 41 II.5. Africa: FDI outflows, by subregion, 1995-2005 ........................................................................................... 45 II.6. South, East and South-East Asia, and Oceania: FDI inflows and their share in gross fixed capital formation, 1995-2005.................................................................................................. 50 II.7. South, East and South-East Asia: top 10 recipients of FDI inflows, 2004-2005 ....................................... 51 II.8. South, East and South-East Asia, and Oceania, FDI outflows, by subregion, 1995-2005 ........................ 54 II.9. South, East and South-East Asia: top 10 sources of FDI outflows, 2004-2005 ......................................... 54 II.10. Pattern of intraregional FDI flows in South, East and South-East Asia, 2002-2004 ................................. 56 II.11. West Asia: FDI inflows and their share in gross fixed capital formation, 1995-2005 ............................... 60 II.12. West Asia: FDI flows, top five economies, 2004-2005 ................................................................................ 62 II.13. West Asia: FDI outflows, by subregion, 1995-2005 ..................................................................................... 63 II.14. Latin America and the Caribbean: FDI inflows and their share in gross fixed capital formation, 1995-2005 ...................................................................................................... 68 II.15. FDI inflows and income on FDI inflows in selected countries in Latin America and the Caribbeana, 2000-2005 ............................................................................................. 69 II.16. Latin America and the Caribbean: FDI flows, top 10 economies, 2004-2005 ........................................... 69 II.17. Latin America and the Caribbean: FDI outflows, by subregion, 1995-2005 .............................................. 71 II.18. Latin America and the Caribbean: FDI inflows by sector, 2004-2005 ........................................................ 71 II.19. South-East Europe and the CIS: FDI inflows and their share in gross fixed capital formation, 1995-2005 .......................................................................................................................... 78 II.20. South-East Europe and the CIS: top 10 economies for FDI inflows, 2004-2005 ...................................... 79 II.21. South-East Europe and the CIS: FDI outflows, by subregion, 1995-2005 ................................................. 80 II.22. Developed countries: FDI inflows and their share in gross fixed capital formation, 1995-2005 ............. 84 II.23. Developed countries: FDI flows, top 10 economies, 2004-2005 ................................................................. 84 II.24. Developed countries: FDI outflows, by subregion, 1995-2005 ................................................................... 88 III.1. FDI outflows from developing and transition economies, 1980-2005 ...................................................... 107 III.2. Outward FDI flows from developing and transition economies, 1980-2005 ........................................... 108 III.3. Cross-border M&As by TNCs from developing and transition economies, by origin of purchaser, 1987-2005 ............................................................................................................... 109 III.4. Cross-border M&As by developing and transition economies, by destination, 1987-2005 .................... 109 III.5. Outward FDI stock, by source region, 1980-2005 ...................................................................................... 113 III.6. Shares of the main offshore financial centres in FDI flows from developing and transition economies, 1980-2005........................................................................................................... 116 III.7. Cross-border M&A purchases by companies based in developing and transition economies, by sector, 1987-2005.................................................................................................................. 116 III.8. Intraregional and interregional flows in developing countries excluding offshore financial centres, average for 2002-2004 ...................................................................................... 119 III.9. Relationship between real GDP per capita and the share of developing and transition economies in total FDI inflows, 2002-2004 ............................................................................... 120 Page