正在加载图片...

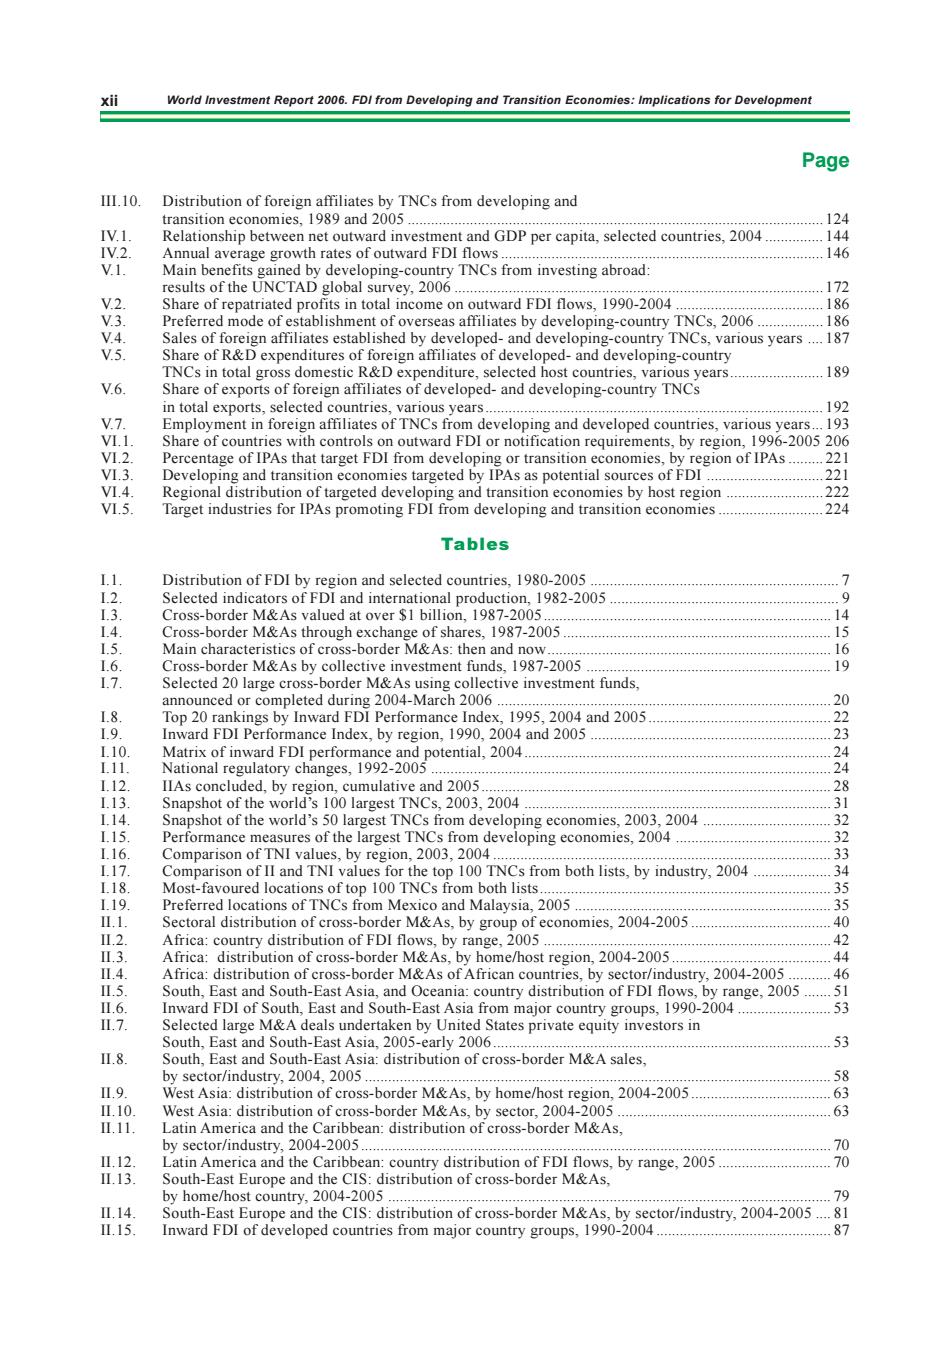
World Investment Report 2006.FDI from Developing and Transition Economies:implic cations for Development Page .10 Dis of fo TNC from developin o an ition 81989md280 nd GDP P .selected 20m. ave age grov UNC AD 2002 sting abroad ard FDI flows 1000.200 erre leveloping-country 2006 ng-cou eloped-and developing-county TNC 189 fexn by host cgio Tables 1234567 1087.200 M&As by collecti det M&A un1987-200 41569 202223 2004 r the top 100 TNCs from both lists,by industry,2004 om Me mics.2004-2003 200 24 ,2004-2005 FDI of S uth. East and South-East Asia rom 1990200nge,200 ast and S uth- 005- 53 .8 2004,2005 2004-200 A sia distribution of cross-border M&As,by 2005 63 ms.2004-2003 distribution of cre M&A East Euro by range.2005 the CIS distribution of xii World Investment Report 2006. FDI from Developing and Transition Economies: Implications for Development III.10. Distribution of foreign affiliates by TNCs from developing and transition economies, 1989 and 2005 ........................................................................................................... 124 IV.1. Relationship between net outward investment and GDP per capita, selected countries, 2004 ............... 144 IV.2. Annual average growth rates of outward FDI flows................................................................................... 146 V.1. Main benefits gained by developing-country TNCs from investing abroad: results of the UNCTAD global survey, 2006 ............................................................................................... 172 V.2. Share of repatriated profits in total income on outward FDI flows, 1990-2004 ...................................... 186 V.3. Preferred mode of establishment of overseas affiliates by developing-country TNCs, 2006 ................. 186 V.4. Sales of foreign affiliates established by developed- and developing-country TNCs, various years .... 187 V.5. Share of R&D expenditures of foreign affiliates of developed- and developing-country TNCs in total gross domestic R&D expenditure, selected host countries, various years........................ 189 V.6. Share of exports of foreign affiliates of developed- and developing-country TNCs in total exports, selected countries, various years....................................................................................... 192 V.7. Employment in foreign affiliates of TNCs from developing and developed countries, various years... 193 VI.1. Share of countries with controls on outward FDI or notification requirements, by region, 1996-2005 206 VI.2. Percentage of IPAs that target FDI from developing or transition economies, by region of IPAs ......... 221 VI.3. Developing and transition economies targeted by IPAs as potential sources of FDI .............................. 221 VI.4. Regional distribution of targeted developing and transition economies by host region ......................... 222 VI.5. Target industries for IPAs promoting FDI from developing and transition economies ........................... 224 I.1. Distribution of FDI by region and selected countries, 1980-2005 ................................................................ 7 I.2. Selected indicators of FDI and international production, 1982-2005 ........................................................... 9 I.3. Cross-border M&As valued at over $1 billion, 1987-2005.......................................................................... 14 I.4. Cross-border M&As through exchange of shares, 1987-2005 ..................................................................... 15 I.5. Main characteristics of cross-border M&As: then and now......................................................................... 16 I.6. Cross-border M&As by collective investment funds, 1987-2005 ............................................................... 19 I.7. Selected 20 large cross-border M&As using collective investment funds, announced or completed during 2004-March 2006 ...................................................................................... 20 I.8. Top 20 rankings by Inward FDI Performance Index, 1995, 2004 and 2005 ............................................... 22 I.9. Inward FDI Performance Index, by region, 1990, 2004 and 2005 .............................................................. 23 I.10. Matrix of inward FDI performance and potential, 2004............................................................................... 24 I.11. National regulatory changes, 1992-2005 ....................................................................................................... 24 I.12. IIAs concluded, by region, cumulative and 2005.......................................................................................... 28 I.13. Snapshot of the world’s 100 largest TNCs, 2003, 2004 ............................................................................... 31 I.14. Snapshot of the world’s 50 largest TNCs from developing economies, 2003, 2004 ................................. 32 I.15. Performance measures of the largest TNCs from developing economies, 2004 ........................................ 32 I.16. Comparison of TNI values, by region, 2003, 2004 ....................................................................................... 33 I.17. Comparison of II and TNI values for the top 100 TNCs from both lists, by industry, 2004 .................... 34 I.18. Most-favoured locations of top 100 TNCs from both lists........................................................................... 35 I.19. Preferred locations of TNCs from Mexico and Malaysia, 2005 .................................................................. 35 II.1. Sectoral distribution of cross-border M&As, by group of economies, 2004-2005 .................................... 40 II.2. Africa: country distribution of FDI flows, by range, 2005 .......................................................................... 42 II.3. Africa: distribution of cross-border M&As, by home/host region, 2004-2005 ......................................... 44 II.4. Africa: distribution of cross-border M&As of African countries, by sector/industry, 2004-2005 ........... 46 II.5. South, East and South-East Asia, and Oceania: country distribution of FDI flows, by range, 2005 ....... 51 II.6. Inward FDI of South, East and South-East Asia from major country groups, 1990-2004 ........................ 53 II.7. Selected large M&A deals undertaken by United States private equity investors in South, East and South-East Asia, 2005-early 2006 ....................................................................................... 53 II.8. South, East and South-East Asia: distribution of cross-border M&A sales, by sector/industry, 2004, 2005 ........................................................................................................................ 58 II.9. West Asia: distribution of cross-border M&As, by home/host region, 2004-2005 .................................... 63 II.10. West Asia: distribution of cross-border M&As, by sector, 2004-2005 ....................................................... 63 II.11. Latin America and the Caribbean: distribution of cross-border M&As, by sector/industry, 2004-2005......................................................................................................................... 70 II.12. Latin America and the Caribbean: country distribution of FDI flows, by range, 2005 ............................. 70 II.13. South-East Europe and the CIS: distribution of cross-border M&As, by home/host country, 2004-2005 .................................................................................................................. 79 II.14. South-East Europe and the CIS: distribution of cross-border M&As, by sector/industry, 2004-2005 .... 81 II.15. Inward FDI of developed countries from major country groups, 1990-2004 ............................................. 87 Page