正在加载图片...
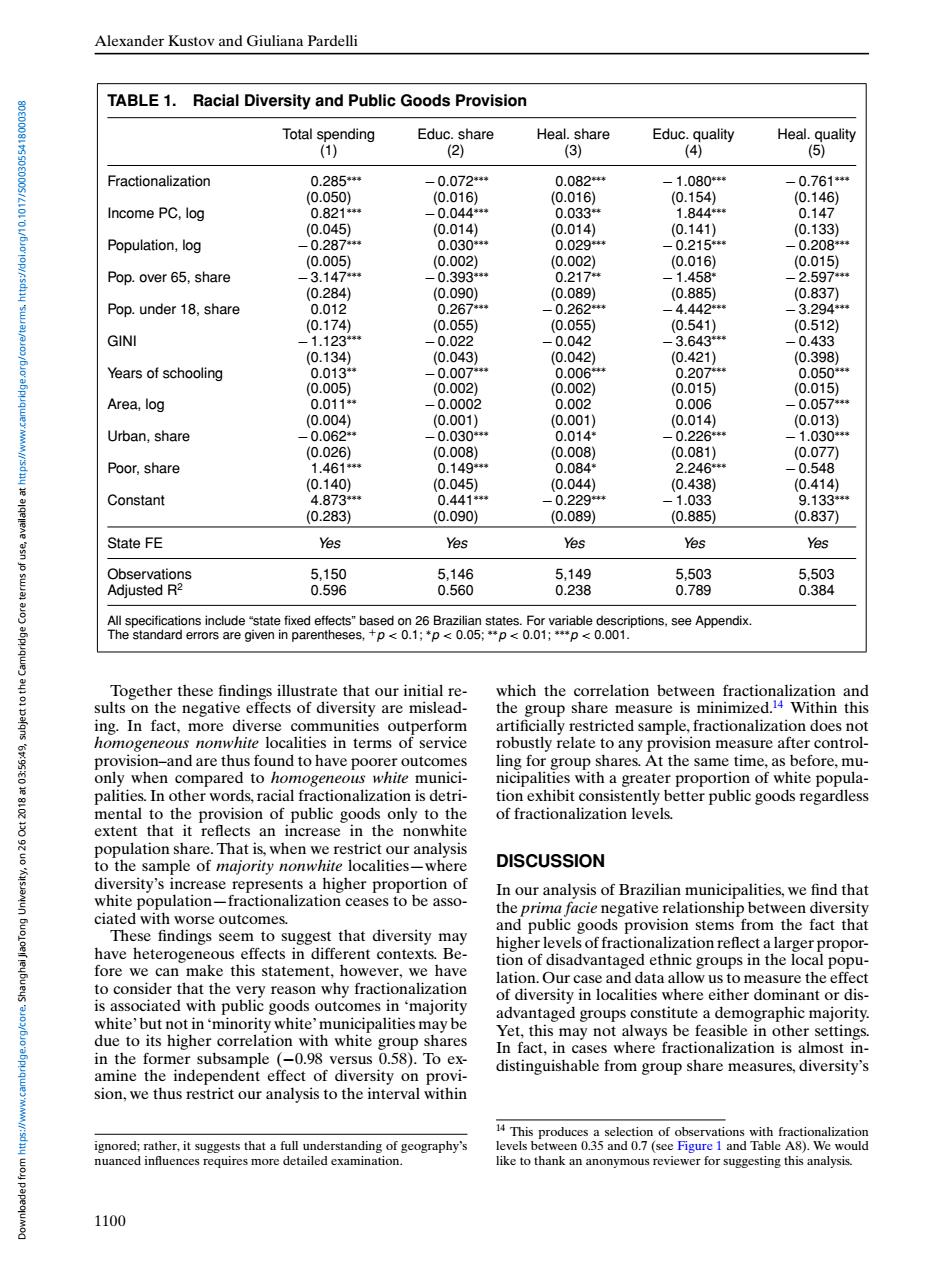
Alexander Kustov and Giuliana Pardelli TABLE 1.Racial Diversity and Public Goods Provision Total spending Educ.share Heal.share Educ.quality Heal.quality (1) (2) (3) (4) (5) Fractionalization 0.285* -0.072** 0.082* -1.080* -0.761** (0.050) (0.016) (0.016) (0.154) (0.146) Income PC,log 0.821** -0.044** 0.033* 1.844* 0.147 (0.045) (0.014) (0.014) (0.141) 0.133) Population,log -0.287* 0.030* 0.029* -0.215* -0.208* (0.005) (0.002) (0.002) (0.016) (0.015) Pop.over 65,share -3.147* -0.393* 0.217体 -1.458* -2.597** (0.284) (0.090) (0.089) (0.885) 0.837) Pop.under 18,share 0.012 0.267* -0.262* -4.442* -3.294* (0.174) (0.055) (0.055) (0.541) (0.512) GINI -1.123** -0.022 -0.042 -3.643* -0.433 (0.134) (0.043) (0.042) (0.421) (0.398) Years of schooling 0.013 0.007* 0.006* 0.207* 0.050* (0.005) (0.002) (0.002) (0.015) 0.015) Area,log 0.011* -0.0002 0.002 0.006 0.057** (0.004) (0.001) (0.001) (0.014) (0.013) Urban,share -0.062* -0.030* 0.014* -0.226* -1.030** (0.026) (0.008) (0.008) (0.081) (0.077) Poor,share 1.461* 0.149** 0.084* 2.246* 0.548 (0.140) (0.045) (0.044) (0.438) (0.414) Constant 4.873** 0.441* -0.229* -1.033 9.133* (0.283) (0.090) (0.089) (0.885) (0.837) State FE Yes Yes Yes Yes Yes Observations 5.150 5,146 5,149 5.503 5.503 Adjusted R2 0.596 0.560 0.238 0.789 0.384 All specifications include "state fixed effects"based on 26 Brazilian states. For variable descriptions,see Appendix. The standard errors are given in parentheses,+p<0.1;*p<0.05;**p<0.01:***p<0.001. Together these findings illustrate that our initial re- which the correlation between fractionalization and sults on the negative effects of diversity are mislead- the group share measure is minimized.14 Within this ing.In fact,more diverse communities outperform artificially restricted sample,fractionalization does not homogeneous nonwhite localities in terms of service robustly relate to any provision measure after control- 685:50190 provision-and are thus found to have poorer outcomes ling for group shares.At the same time,as before,mu- only when compared to homogeneous white munici- nicipalities with a greater proportion of white popula- palities.In other words,racial fractionalization is detri- tion exhibit consistently better public goods regardless mental to the provision of public goods only to the of fractionalization levels. extent that it reflects an increase in the nonwhite population share.That is,when we restrict our analysis to the sample of majority nonwhite localities-where DISCUSSION diversity's increase represents a higher proportion of In our analysis of Brazilian municipalities,we find that white population-fractionalization ceases to be asso- the prima facie negative relationship between diversity ciated with worse outcomes. and public goods provision stems from the fact that These findings seem to suggest that diversity may have heterogeneous effects in different contexts.Be- higher levels of fractionalization reflect a larger propor- fore we can make this statement,however,we have tion of disadvantaged ethnic groups in the local popu- lation.Our case and data allow us to measure the effect to consider that the very reason why fractionalization of diversity in localities where either dominant or dis- is associated with public goods outcomes in'majority white'but not in'minority white'municipalities may be advantaged groups constitute a demographic majority. due to its higher correlation with white group shares Yet,this may not always be feasible in other settings. In fact,in cases where fractionalization is almost in- in the former subsample (-0.98 versus 0.58).To ex- amine the independent effect of diversity on provi- distinguishable from group share measures,diversity's sion,we thus restrict our analysis to the interval within 4 This produces a selection of observations with fractionalization ignored;rather,it suggests that a full understanding of geography's levels between 0.35 and 0.7 (see Figure 1 and Table A8).We would nuanced infuences requires more detailed examination. like to thank an anonymous reviewer for suggesting this analysis. 1100Alexander Kustov and Giuliana Pardelli TABLE 1. Racial Diversity and Public Goods Provision Total spending Educ. share Heal. share Educ. quality Heal. quality (1) (2) (3) (4) (5) Fractionalization 0.285∗∗∗ − 0.072∗∗∗ 0.082∗∗∗ − 1.080∗∗∗ − 0.761∗∗∗ (0.050) (0.016) (0.016) (0.154) (0.146) Income PC, log 0.821∗∗∗ − 0.044∗∗∗ 0.033∗∗ 1.844∗∗∗ 0.147 (0.045) (0.014) (0.014) (0.141) (0.133) Population, log − 0.287∗∗∗ 0.030∗∗∗ 0.029∗∗∗ − 0.215∗∗∗ − 0.208∗∗∗ (0.005) (0.002) (0.002) (0.016) (0.015) Pop. over 65, share − 3.147∗∗∗ − 0.393∗∗∗ 0.217∗∗ − 1.458∗ − 2.597∗∗∗ (0.284) (0.090) (0.089) (0.885) (0.837) Pop. under 18, share 0.012 0.267∗∗∗ − 0.262∗∗∗ − 4.442∗∗∗ − 3.294∗∗∗ (0.174) (0.055) (0.055) (0.541) (0.512) GINI − 1.123∗∗∗ − 0.022 − 0.042 − 3.643∗∗∗ − 0.433 (0.134) (0.043) (0.042) (0.421) (0.398) Years of schooling 0.013∗∗ − 0.007∗∗∗ 0.006∗∗∗ 0.207∗∗∗ 0.050∗∗∗ (0.005) (0.002) (0.002) (0.015) (0.015) Area, log 0.011∗∗ − 0.0002 0.002 0.006 − 0.057∗∗∗ (0.004) (0.001) (0.001) (0.014) (0.013) Urban, share − 0.062∗∗ − 0.030∗∗∗ 0.014∗ − 0.226∗∗∗ − 1.030∗∗∗ (0.026) (0.008) (0.008) (0.081) (0.077) Poor, share 1.461∗∗∗ 0.149∗∗∗ 0.084∗ 2.246∗∗∗ − 0.548 (0.140) (0.045) (0.044) (0.438) (0.414) Constant 4.873∗∗∗ 0.441∗∗∗ − 0.229∗∗∗ − 1.033 9.133∗∗∗ (0.283) (0.090) (0.089) (0.885) (0.837) State FE Yes Yes Yes Yes Yes Observations 5,150 5,146 5,149 5,503 5,503 Adjusted R2 0.596 0.560 0.238 0.789 0.384 All specifications include “state fixed effects” based on 26 Brazilian states. For variable descriptions, see Appendix. The standard errors are given in parentheses, +p < 0.1; ∗p < 0.05; ∗∗p < 0.01; ∗∗∗p < 0.001. Together these findings illustrate that our initial results on the negative effects of diversity are misleading. In fact, more diverse communities outperform homogeneous nonwhite localities in terms of service provision–and are thus found to have poorer outcomes only when compared to homogeneous white municipalities. In other words, racial fractionalization is detrimental to the provision of public goods only to the extent that it reflects an increase in the nonwhite population share. That is, when we restrict our analysis to the sample of majority nonwhite localities—where diversity’s increase represents a higher proportion of white population—fractionalization ceases to be associated with worse outcomes. These findings seem to suggest that diversity may have heterogeneous effects in different contexts. Before we can make this statement, however, we have to consider that the very reason why fractionalization is associated with public goods outcomes in ‘majority white’ but not in ‘minority white’ municipalities may be due to its higher correlation with white group shares in the former subsample (−0.98 versus 0.58). To examine the independent effect of diversity on provision, we thus restrict our analysis to the interval within ignored; rather, it suggests that a full understanding of geography’s nuanced influences requires more detailed examination. which the correlation between fractionalization and the group share measure is minimized.14 Within this artificially restricted sample, fractionalization does not robustly relate to any provision measure after controlling for group shares. At the same time, as before, municipalities with a greater proportion of white population exhibit consistently better public goods regardless of fractionalization levels. DISCUSSION In our analysis of Brazilian municipalities, we find that the prima facie negative relationship between diversity and public goods provision stems from the fact that higher levels of fractionalization reflect a larger proportion of disadvantaged ethnic groups in the local population. Our case and data allow us to measure the effect of diversity in localities where either dominant or disadvantaged groups constitute a demographic majority. Yet, this may not always be feasible in other settings. In fact, in cases where fractionalization is almost indistinguishable from group share measures, diversity’s 14 This produces a selection of observations with fractionalization levels between 0.35 and 0.7 (see Figure 1 and Table A8). We would like to thank an anonymous reviewer for suggesting this analysis. 1100 Downloaded from https://www.cambridge.org/core. Shanghai JiaoTong University, on 26 Oct 2018 at 03:56:49, subject to the Cambridge Core terms of use, available at https://www.cambridge.org/core/terms. https://doi.org/10.1017/S0003055418000308