正在加载图片...
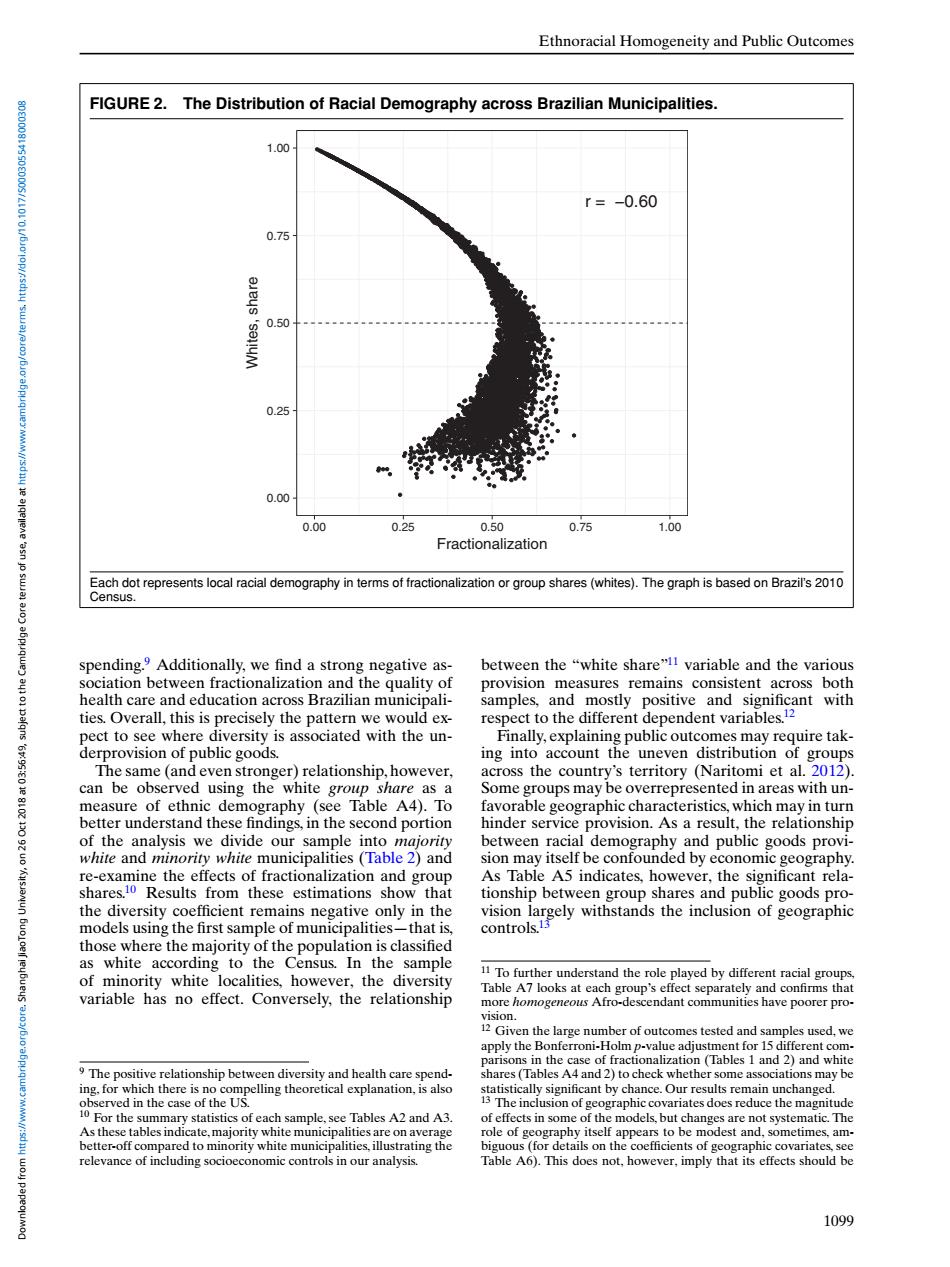
Ethnoracial Homogeneity and Public Outcomes FIGURE 2.The Distribution of Racial Demography across Brazilian Municipalities. 1.00 r=-0.60 0.75 0.50 0.25 0.00 0.00 0.25 0.50 0.75 1.00 'asn Fractionalization Each dot represents local racial demography in terms of fractionalization or group shares(whites).The graph is based on Brazil's 2010 Census. spending.Additionally,we find a strong negative as- between the "white share"11 variable and the various sociation between fractionalization and the quality of provision measures remains consistent across both health care and education across Brazilian municipali- samples,and mostly positive and significant with ties.Overall,this is precisely the pattern we would ex- respect to the different dependent variables.12 pect to see where diversity is associated with the un- Finally,explaining public outcomes may require tak- derprovision of public goods. ing into account the uneven distribution of groups The same(and even stronger)relationship,however, across the country's territory (Naritomi et al.2012). can be observed using the white group share as a Some groups may be overrepresented in areas with un- measure of ethnic demography (see Table A4).To favorable geographic characteristics,which may in turn better understand these findings,in the second portion hinder service provision.As a result,the relationship of the analysis we divide our sample into majority between racial demography and public goods provi- white and minority white municipalities (Table 2)and sion may itself be confounded by economic geography. re-examine the effects of fractionalization and group As Table A5 indicates,however,the significant rela- shares.10 Results from these estimations show that tionship between group shares and public goods pro- the diversity coefficient remains negative only in the vision largely withstands the inclusion of geographic models using the first sample of municipalities-that is, controls.13 those where the majority of the population is classified as white according to the Census.In the sample of minority white localities,however,the diversity 11 To further understand the role played by different racial groups. variable has no effect.Conversely,the relationship Table A7 looks at each group's effect separately and confirms that more homogeneous Afro-descendant communities have poorer pro- the large number of outcomes tested and samples apply the Bonferroni-Holm p-value adjustment for 15 different com. parisons in the case of fractionalization (Tables 1 and 2)and white The positive relationship between diversity and health care spend- shares (Tables A4 and 2)to check whether some associations may be ing,for which there is no compelling theoretical explanation,is also statistically significant by chance.Our results remain unchanged. observed in the case of the US. 13 The inclusion of geographic covariates does reduce the magnitude 10 For the summary statistics of each sample,see Tables A2 and A3. of effects in some of the models,but changes are not systematic.The As these tables indicate,majority white municipalities are on average role of geography itself appears to be modest and,sometimes,am- better-off compared to minority white municipalities,illustrating the biguous (for details on the coefficients of geographic covariates,see relevance of including socioeconomic controls in our analysis. Table A6).This does not,however,imply that its effects should be 1099Ethnoracial Homogeneity and Public Outcomes FIGURE 2. The Distribution of Racial Demography across Brazilian Municipalities. r = −0.60 0.00 0.25 0.50 0.75 1.00 0.00 0.25 0.50 0.75 1.00 Fractionalization Whites, share Each dot represents local racial demography in terms of fractionalization or group shares (whites). The graph is based on Brazil’s 2010 Census. spending.9 Additionally, we find a strong negative association between fractionalization and the quality of health care and education across Brazilian municipalities. Overall, this is precisely the pattern we would expect to see where diversity is associated with the underprovision of public goods. The same (and even stronger) relationship, however, can be observed using the white group share as a measure of ethnic demography (see Table A4). To better understand these findings, in the second portion of the analysis we divide our sample into majority white and minority white municipalities (Table 2) and re-examine the effects of fractionalization and group shares.10 Results from these estimations show that the diversity coefficient remains negative only in the models using the first sample of municipalities—that is, those where the majority of the population is classified as white according to the Census. In the sample of minority white localities, however, the diversity variable has no effect. Conversely, the relationship 9 The positive relationship between diversity and health care spending, for which there is no compelling theoretical explanation, is also observed in the case of the US. 10 For the summary statistics of each sample, see Tables A2 and A3. As these tables indicate,majority white municipalities are on average better-off compared to minority white municipalities, illustrating the relevance of including socioeconomic controls in our analysis. between the “white share”11 variable and the various provision measures remains consistent across both samples, and mostly positive and significant with respect to the different dependent variables.12 Finally, explaining public outcomes may require taking into account the uneven distribution of groups across the country’s territory (Naritomi et al. 2012). Some groups may be overrepresented in areas with unfavorable geographic characteristics, which may in turn hinder service provision. As a result, the relationship between racial demography and public goods provision may itself be confounded by economic geography. As Table A5 indicates, however, the significant relationship between group shares and public goods provision largely withstands the inclusion of geographic controls.13 11 To further understand the role played by different racial groups, Table A7 looks at each group’s effect separately and confirms that more homogeneous Afro-descendant communities have poorer provision. 12 Given the large number of outcomes tested and samples used, we apply the Bonferroni-Holm p-value adjustment for 15 different comparisons in the case of fractionalization (Tables 1 and 2) and white shares (Tables A4 and 2) to check whether some associations may be statistically significant by chance. Our results remain unchanged. 13 The inclusion of geographic covariates does reduce the magnitude of effects in some of the models, but changes are not systematic. The role of geography itself appears to be modest and, sometimes, ambiguous (for details on the coefficients of geographic covariates, see Table A6). This does not, however, imply that its effects should be 1099 Downloaded from https://www.cambridge.org/core. Shanghai JiaoTong University, on 26 Oct 2018 at 03:56:49, subject to the Cambridge Core terms of use, available at https://www.cambridge.org/core/terms. https://doi.org/10.1017/S0003055418000308