正在加载图片...
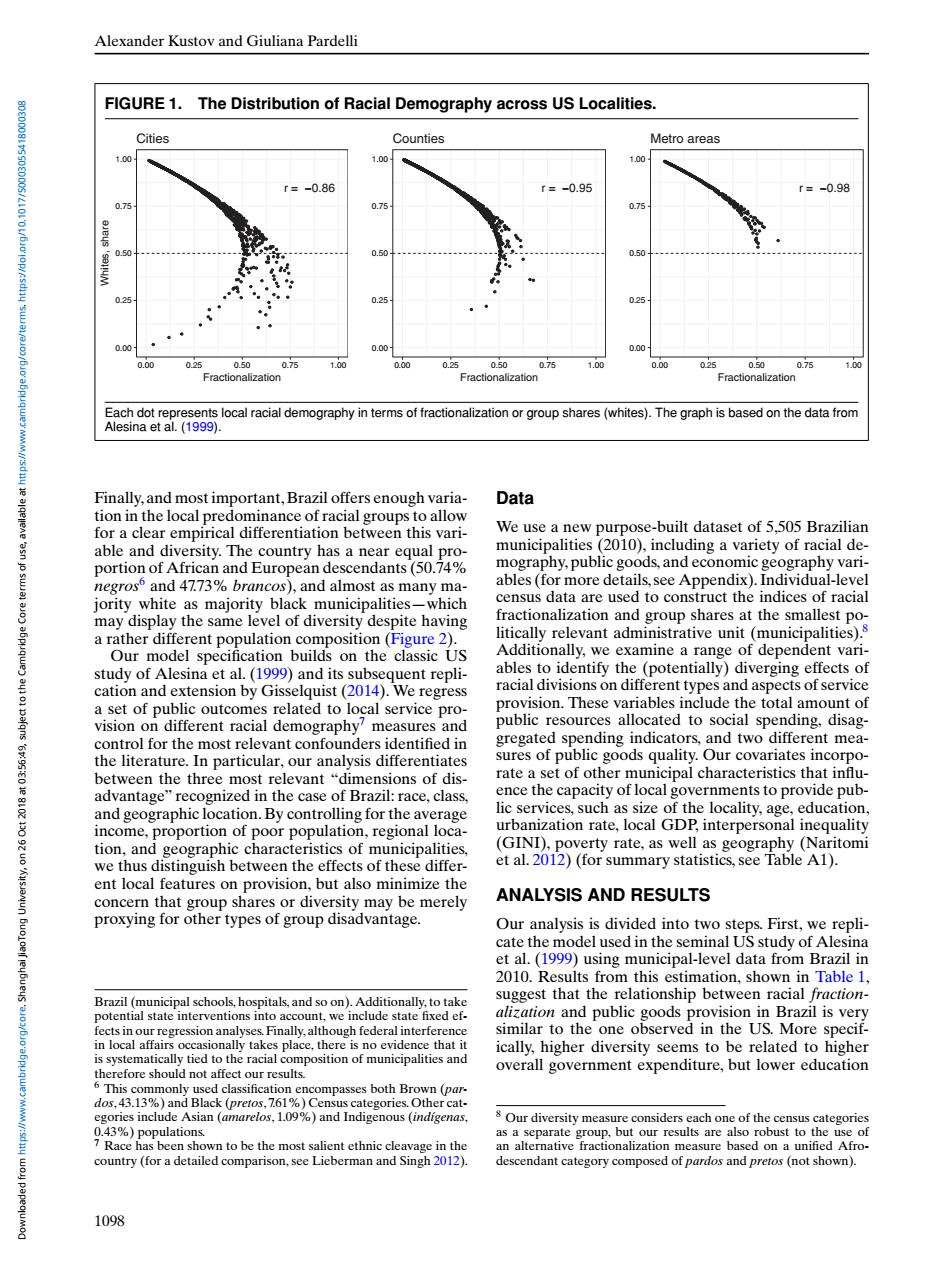
Alexander Kustov and Giuliana Pardelli FIGURE 1.The Distribution of Racial Demography across US Localities. Cities Counties Metro areas 00 100 100 r=-0.86 r=-0.95 -0.98 0.75 0.75 0.75 0.50 0.50 0.50 025 0.25- 025 0.00 0.00 0.00 0.00 0.25 0.50 0.75 1.00 0.00 0.25 0.50 0.75 1.00 0.00 0.25 0.50 0.75 100 Fractionalization Fractionalization Fractionalization Each dot represents local racial demography in terms of fractionalization or group shares(whites).The graph is based on the data from Alesina et al.(1999). Finally,and most important,Brazil offers enough varia- Data tion in the local predominance of racial groups to allow for a clear empirical differentiation between this vari- We use a new purpose-built dataset of 5,505 Brazilian able and diversity.The country has a near equal pro- municipalities(2010),including a variety of racial de- & portion of African and European descendants(50.74% mography,public goods,and economic geography vari- negros and 4773%brancos),and almost as many ma- ables(for more details,see Appendix).Individual-level jority white as majority black municipalities-which census data are used to construct the indices of racial may display the same level of diversity despite having fractionalization and group shares at the smallest po- a rather different population composition(Figure 2). litically relevant administrative unit (municipalities).s Our model specification builds on the classic US Additionally,we examine a range of dependent vari- study of Alesina et al.(1999)and its subsequent repli- ables to identify the (potentially)diverging effects of cation and extension by Gisselquist(2014).We regress racial divisions on different types and aspects of service a set of public outcomes related to local service pro- provision.These variables include the total amount of vision on different racial demography'measures and public resources allocated to social spending,disag- control for the most relevant confounders identified in gregated spending indicators,and two different mea- the literature.In particular,our analysis differentiates sures of public goods quality.Our covariates incorpo- between the three most relevant "dimensions of dis- rate a set of other municipal characteristics that influ- advantage"recognized in the case of Brazil:race,class. ence the capacity of local governments to provide pub- and geographic location.By controlling for the average lic services,such as size of the locality,age,education, income,proportion of poor population,regional loca- urbanization rate,local GDP,interpersonal inequality tion,and geographic characteristics of municipalities, (GINI),poverty rate,as well as geography (Naritomi we thus distinguish between the effects of these differ- et al.2012)(for summary statistics,see Table A1). ent local features on provision,but also minimize the concern that group shares or diversity may be merely ANALYSIS AND RESULTS proxying for other types of group disadvantage. Our analysis is divided into two steps.First,we repli- cate the model used in the seminal US study of Alesina et al.(1999)using municipal-level data from Brazil in 2010.Results from this estimation.shown in Table 1. eys Brazil (municipal schools,hospitals,and so on).Additionally,to take suggest that the relationship between racial fraction- potential state interventions into account,we include state fixed ef- alization and public goods provision in Brazil is very fects in our regression analyses.Finally,although federal interference similar to the one observed in the US.More specif- in local affairs occasionally takes place,there is no evidence that it ically,higher diversity seems to be related to higher is systematically tied to the racial composition of municipalities and therefore should not affect our results. overall government expenditure,but lower education 6 This commonly used classification encompasses both Brown(par dos,43.13%)and Black (pretos,761%)Census categories.Other cat- egories include Asian (amarelos,109%)and Indigenous(indigenas, 8 Our diversity measure considers each one of the census categories 0.43%)populations. as a separate group,but our results are also robust to the use of Race has been shown to be the most salient ethnic cleavage in the an alternative fractionalization measure based on a unified Afro- country (for a detailed comparison,see Lieberman and Singh 2012). descendant category composed of pardos and pretos (not shown). 1098Alexander Kustov and Giuliana Pardelli FIGURE 1. The Distribution of Racial Demography across US Localities. r = −0.86 0.00 0.25 0.50 0.75 1.00 0.00 0.25 0.50 0.75 1.00 Fractionalization Whites, share Cities r = −0.95 0.00 0.25 0.50 0.75 1.00 0.00 0.25 0.50 0.75 1.00 Fractionalization Counties r = −0.98 0.00 0.25 0.50 0.75 1.00 0.00 0.25 0.50 0.75 1.00 Fractionalization Metro areas Each dot represents local racial demography in terms of fractionalization or group shares (whites). The graph is based on the data from Alesina et al. (1999). Finally, and most important, Brazil offers enough variation in the local predominance of racial groups to allow for a clear empirical differentiation between this variable and diversity. The country has a near equal proportion of African and European descendants (50.74% negros6 and 47.73% brancos), and almost as many majority white as majority black municipalities—which may display the same level of diversity despite having a rather different population composition (Figure 2). Our model specification builds on the classic US study of Alesina et al. (1999) and its subsequent replication and extension by Gisselquist (2014). We regress a set of public outcomes related to local service provision on different racial demography7 measures and control for the most relevant confounders identified in the literature. In particular, our analysis differentiates between the three most relevant “dimensions of disadvantage” recognized in the case of Brazil: race, class, and geographic location. By controlling for the average income, proportion of poor population, regional location, and geographic characteristics of municipalities, we thus distinguish between the effects of these different local features on provision, but also minimize the concern that group shares or diversity may be merely proxying for other types of group disadvantage. Brazil (municipal schools, hospitals, and so on). Additionally, to take potential state interventions into account, we include state fixed effects in our regression analyses. Finally, although federal interference in local affairs occasionally takes place, there is no evidence that it is systematically tied to the racial composition of municipalities and therefore should not affect our results. 6 This commonly used classification encompasses both Brown (pardos, 43.13%) and Black (pretos, 7.61%) Census categories. Other categories include Asian (amarelos, 1.09%) and Indigenous (indígenas, 0.43%) populations. 7 Race has been shown to be the most salient ethnic cleavage in the country (for a detailed comparison, see Lieberman and Singh 2012). Data We use a new purpose-built dataset of 5,505 Brazilian municipalities (2010), including a variety of racial demography, public goods, and economic geography variables (for more details, see Appendix). Individual-level census data are used to construct the indices of racial fractionalization and group shares at the smallest politically relevant administrative unit (municipalities).8 Additionally, we examine a range of dependent variables to identify the (potentially) diverging effects of racial divisions on different types and aspects of service provision. These variables include the total amount of public resources allocated to social spending, disaggregated spending indicators, and two different measures of public goods quality. Our covariates incorporate a set of other municipal characteristics that influence the capacity of local governments to provide public services, such as size of the locality, age, education, urbanization rate, local GDP, interpersonal inequality (GINI), poverty rate, as well as geography (Naritomi et al. 2012) (for summary statistics, see Table A1). ANALYSIS AND RESULTS Our analysis is divided into two steps. First, we replicate the model used in the seminal US study of Alesina et al. (1999) using municipal-level data from Brazil in 2010. Results from this estimation, shown in Table 1, suggest that the relationship between racial fractionalization and public goods provision in Brazil is very similar to the one observed in the US. More specifically, higher diversity seems to be related to higher overall government expenditure, but lower education 8 Our diversity measure considers each one of the census categories as a separate group, but our results are also robust to the use of an alternative fractionalization measure based on a unified Afrodescendant category composed of pardos and pretos (not shown). 1098 Downloaded from https://www.cambridge.org/core. Shanghai JiaoTong University, on 26 Oct 2018 at 03:56:49, subject to the Cambridge Core terms of use, available at https://www.cambridge.org/core/terms. https://doi.org/10.1017/S0003055418000308