正在加载图片...

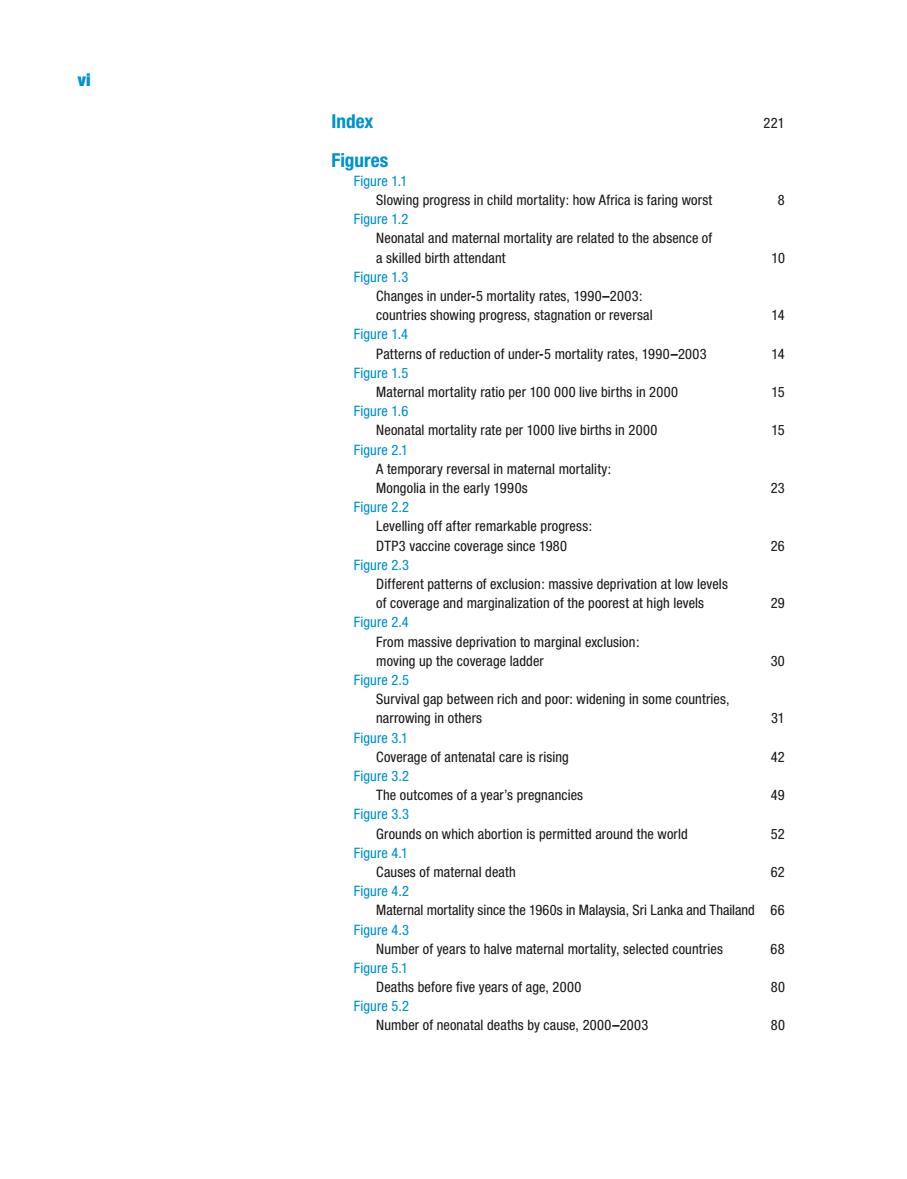
i Index 221 Figures Figure 1.1 Slowing progress in child mortality:how Africa is faring worst 8 Figure 1.2 Neonatal and maternal mortality are related to the absence of a skilled birth attendant 10 Figure 1.3 Changes in under-5 mortality rates,1990-2003: countries showing progress,stagnation or reversal 14 Figure 1.4 Patterns of reduction of under-5 mortality rates,1990-2003 14 Figure 1.5 Maternal mortality ratio per 100 000 live births in 2000 15 Figure 1.6 Neonatal mortality rate per 1000 live births in 2000 15 Figure 2.1 A temporary reversal in maternal mortality: Mongolia in the early 1990s 23 Fiqure 2.2 Levelling off after remarkable progress: DTP3 vaccine coverage since 1980 26 Figure 2.3 Different patterns of exclusion:massive deprivation at low levels of coverage and marginalization of the poorest at high levels 29 Figure 2.4 From massive deprivation to marginal exclusion: moving up the coverage ladder 30 Figure 2.5 Survival gap between rich and poor:widening in some countries narrowing in others Figure 3.1 Coverage of antenatal care is rising 42 Figure 3.2 The outcomes of a year's pregnancies 49 Figure 3.3 Grounds on which abortion is permitted around the world 52 Figure 4.1 Causes of maternal death 62 Figure 4.2 Maternal mortality since the 1960s in Malaysia,Sri Lanka and Thailand 66 Figure 4.3 Number of years to halve materal mortality,selected countries 68 Figure 5.1 Deaths before five years of age,2000 80 Figure 5.2 Number of neonatal deaths by cause,2000-2003 80vi Index 221 Figures Figure 1.1 Slowing progress in child mortality: how Africa is faring worst 8 Figure 1.2 Neonatal and maternal mortality are related to the absence of a skilled birth attendant 10 Figure 1.3 Changes in under-5 mortality rates, 1990–2003: countries showing progress, stagnation or reversal 14 Figure 1.4 Patterns of reduction of under-5 mortality rates, 1990–2003 14 Figure 1.5 Maternal mortality ratio per 100 000 live births in 2000 15 Figure 1.6 Neonatal mortality rate per 1000 live births in 2000 15 Figure 2.1 A temporary reversal in maternal mortality: Mongolia in the early 1990s 23 Figure 2.2 Levelling off after remarkable progress: DTP3 vaccine coverage since 1980 26 Figure 2.3 Different patterns of exclusion: massive deprivation at low levels of coverage and marginalization of the poorest at high levels 29 Figure 2.4 From massive deprivation to marginal exclusion: moving up the coverage ladder 30 Figure 2.5 Survival gap between rich and poor: widening in some countries, narrowing in others 31 Figure 3.1 Coverage of antenatal care is rising 42 Figure 3.2 The outcomes of a year’s pregnancies 49 Figure 3.3 Grounds on which abortion is permitted around the world 52 Figure 4.1 Causes of maternal death 62 Figure 4.2 Maternal mortality since the 1960s in Malaysia, Sri Lanka and Thailand 66 Figure 4.3 Number of years to halve maternal mortality, selected countries 68 Figure 5.1 Deaths before five years of age, 2000 80 Figure 5.2 Number of neonatal deaths by cause, 2000–2003 80 The World Health Report 2005