正在加载图片...

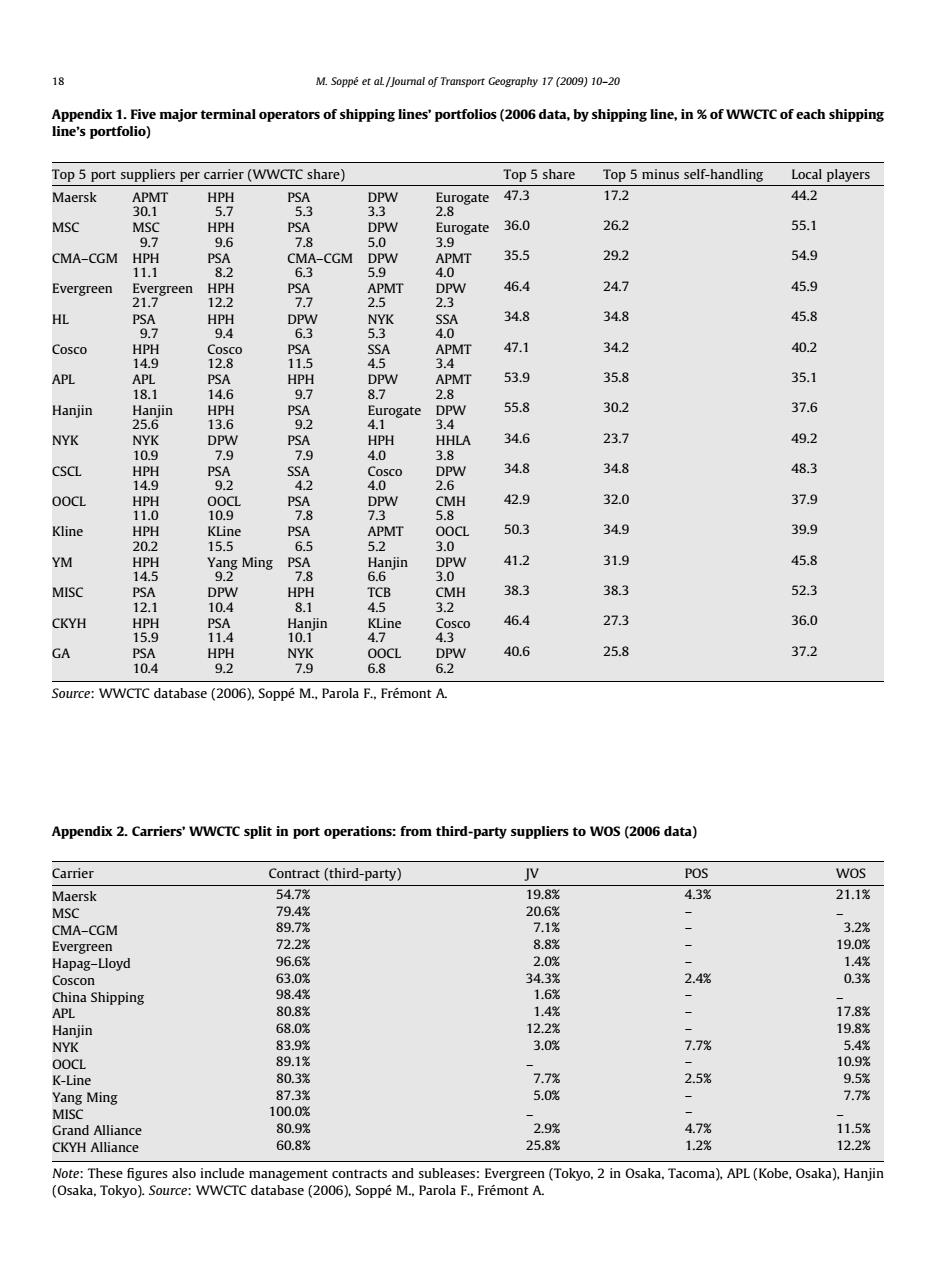
18 M.Soppe et aL/Joumal of Transport Geography 17(2009)10-20 Appendix 1.Five major terminal operators of shipping lines'portfolios(2006 data,by shipping line,in of WWCTC of each shipping line's portfolio) Top 5 port suppliers per carrier(WWCTC share) Top 5 share Top 5 minus self-handling Local players Maersk APMT HPH PSA DPW Eurogate 47.3 17.2 44.2 30.1 5.7 5.3 3.3 2.8 MSC MSC HPH PSA DPW Eurogate 36.0 26.2 55.1 9.7 9.6 7.8 5.0 3.9 CMA-CGM HPH PSA CMA-CGM DPW APMT 35.5 29.2 54.9 11.1 8.2 6.3 5.9 4.0 Evergreen Evergreen HPH PSA APMT DPW 46.4 24.7 45.9 21.7 12.2 .7 2.5 2.3 HL PSA HPH DPW NYK SSA 34.8 34.8 45.8 9.7 9.4 6.3 5.3 4.0 Cosco HPH Cosco PSA SSA APMT 47.1 34.2 40.2 14.9 12.8 11.5 4.5 3.4 APL APL PSA HPH DPW APMT 53.9 35.8 35.1 18.1 14.6 9.7 8.7 2.8 Hanjin Hanjin HPH PSA Eurogate DPW 55.8 30.2 37.6 25.6 13.6 2 4.1 3.4 NYK NYK DPW HPH HHLA 34.6 23.7 49.2 10.9 7.9 7.9 4.0 3.8 CSCL HPH PSA SSA Cosco DPW 34.8 34.8 48.3 14.9 .2 .2 4.0 2.6 OOCL HPH 00L PSA DPW CMH 42.9 32.0 37.9 11.0 10.9 7.8 7.3 5.8 Kline HPH KLine PSA APMT OOCL 50.3 34.9 39.9 20.2 15.5 6.5 5.2 3.0 YM HPH Yg2竖Mg PSA Hanjin DPW 41.2 31.9 45.8 14.5 7.8 6.6 3.0 MISC PSA DPW HPH TCB CMH 38.3 38.3 52.3 12.1 10.4 8.1 4.5 3.2 CKYH HPH PSA Hanjin KLine Cosco 46.4 27.3 36.0 15.9 11.4 10.1 4.7 4.3 GA PSA HPH NYK OOCL DPW 40.6 25.8 37.2 10.4 9.2 7.9 6.8 6.2 Source:WWCTC database(2006).Soppe M.,Parola F.,Fremont A. Appendix 2.Carriers'WWCTC split in port operations:from third-party suppliers to WOS(2006 data) Carrier Contract (third-party) V POS WoS Maersk 54.7% 19.8% 4.3% 21.1% MSC 79.4% 20.6% CMA-CGM 89.7% 7.1% 3.2% Evergreen 72.2% 8.8% 19.0% Hapag-Lloyd 96.6% 2.0% 1.4% Coscon 63.0% 34.3% 2.4% 0.3% China Shipping 98.4% 1.6% APL 80.8% 1.4% 17.8% Hanjin 68.0% 12.2% 19.8% NYK 83.9% 3.0% 7.7% 5.4% OOCL 89.1% 10.9% K-Line 80.3% 7.7% 2.5% 9.5% Yang Ming 87.3% 5.0% 7.7% MISC 100.0% Grand Alliance 80.9% 2.9% 4.7% 11.5% CKYH Alliance 60.8% 25.8% 12% 12.2% Note:These figures also include management contracts and subleases:Evergreen(Tokyo,2 in Osaka,Tacoma).APL(Kobe,Osaka),Hanjin (Osaka,Tokyo).Source:WWCTC database(2006).Soppe M..Parola F..Fremont A.Appendix 1. Five major terminal operators of shipping lines’ portfolios (2006 data, by shipping line, in % of WWCTC of each shipping line’s portfolio) Top 5 port suppliers per carrier (WWCTC share) Top 5 share Top 5 minus self-handling Local players Maersk APMT HPH PSA DPW Eurogate 47.3 17.2 44.2 30.1 5.7 5.3 3.3 2.8 MSC MSC HPH PSA DPW Eurogate 36.0 26.2 55.1 9.7 9.6 7.8 5.0 3.9 CMA–CGM HPH PSA CMA–CGM DPW APMT 35.5 29.2 54.9 11.1 8.2 6.3 5.9 4.0 Evergreen Evergreen HPH PSA APMT DPW 46.4 24.7 45.9 21.7 12.2 7.7 2.5 2.3 HL PSA HPH DPW NYK SSA 34.8 34.8 45.8 9.7 9.4 6.3 5.3 4.0 Cosco HPH Cosco PSA SSA APMT 47.1 34.2 40.2 14.9 12.8 11.5 4.5 3.4 APL APL PSA HPH DPW APMT 53.9 35.8 35.1 18.1 14.6 9.7 8.7 2.8 Hanjin Hanjin HPH PSA Eurogate DPW 55.8 30.2 37.6 25.6 13.6 9.2 4.1 3.4 NYK NYK DPW PSA HPH HHLA 34.6 23.7 49.2 10.9 7.9 7.9 4.0 3.8 CSCL HPH PSA SSA Cosco DPW 34.8 34.8 48.3 14.9 9.2 4.2 4.0 2.6 OOCL HPH OOCL PSA DPW CMH 42.9 32.0 37.9 11.0 10.9 7.8 7.3 5.8 Kline HPH KLine PSA APMT OOCL 50.3 34.9 39.9 20.2 15.5 6.5 5.2 3.0 YM HPH Yang Ming PSA Hanjin DPW 41.2 31.9 45.8 14.5 9.2 7.8 6.6 3.0 MISC PSA DPW HPH TCB CMH 38.3 38.3 52.3 12.1 10.4 8.1 4.5 3.2 CKYH HPH PSA Hanjin KLine Cosco 46.4 27.3 36.0 15.9 11.4 10.1 4.7 4.3 GA PSA HPH NYK OOCL DPW 40.6 25.8 37.2 10.4 9.2 7.9 6.8 6.2 Source: WWCTC database (2006), Soppé M., Parola F., Frémont A. Appendix 2. Carriers’ WWCTC split in port operations: from third-party suppliers to WOS (2006 data) Carrier Contract (third-party) JV POS WOS Maersk 54.7% 19.8% 4.3% 21.1% MSC 79.4% 20.6% – – CMA–CGM 89.7% 7.1% – 3.2% Evergreen 72.2% 8.8% – 19.0% Hapag–Lloyd 96.6% 2.0% – 1.4% Coscon 63.0% 34.3% 2.4% 0.3% China Shipping 98.4% 1.6% – – APL 80.8% 1.4% – 17.8% Hanjin 68.0% 12.2% – 19.8% NYK 83.9% 3.0% 7.7% 5.4% OOCL 89.1% – – 10.9% K-Line 80.3% 7.7% 2.5% 9.5% Yang Ming 87.3% 5.0% – 7.7% MISC 100.0% – – – Grand Alliance 80.9% 2.9% 4.7% 11.5% CKYH Alliance 60.8% 25.8% 1.2% 12.2% Note: These figures also include management contracts and subleases: Evergreen (Tokyo, 2 in Osaka, Tacoma), APL (Kobe, Osaka), Hanjin (Osaka, Tokyo). Source: WWCTC database (2006), Soppé M., Parola F., Frémont A. 18 M. Soppé et al. / Journal of Transport Geography 17 (2009) 10–20