正在加载图片...

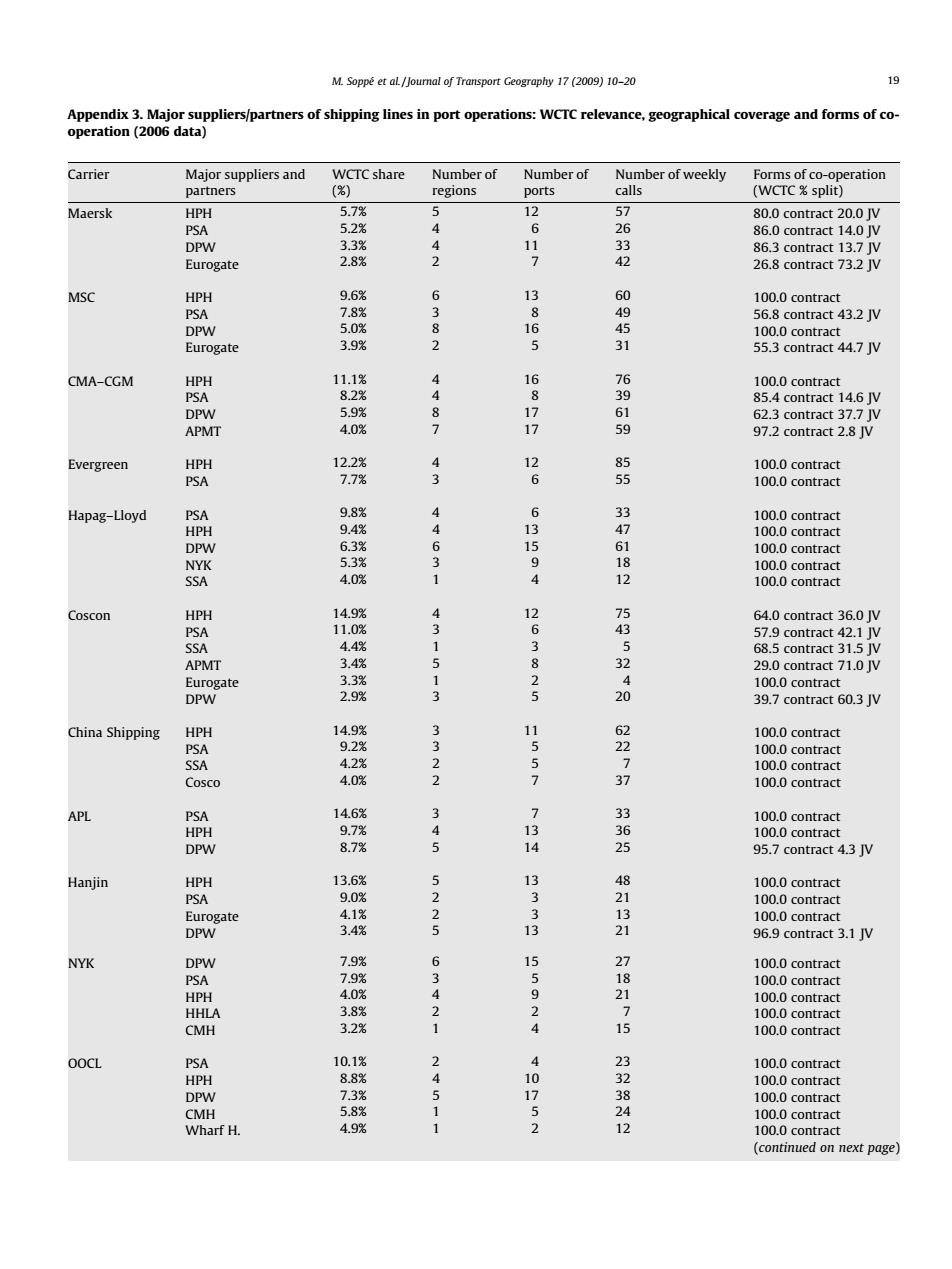
M.Soppe et aL/Journal of Transport Geography 17(2009)10-20 19 Appendix 3.Major suppliers/partners of shipping lines in port operations:WCTC relevance,geographical coverage and forms of co- operation(2006 data) Carrier Major suppliers and WCTC share Number of Number of Number of weekly Forms of co-operation partners () regions ports calls (WCTC%split) Maersk HPH 5.7% 12 57 80.0 contract 20.0 JV PSA 5.2% 6 26 86.0 contract 14.0 JV DPW 3.3% 11 33 86.3 contract 13.7 JV Eurogate 2.8% 3 > 42 26.8 contract 73.2 JV MSC HPH 9.6% 6 13 60 100.0 contract PSA 7.8% P 49 56.8 contract 43.2 JV DPW 5.0% P 16 100.0 contract Eurogate 3.9% 31 55.3 contract 44.7 V CMA-CGM HPH 11.1% 76 100.0 contract PSA 8.2% 8 39 85.4 contract 14.6 IV DPW 5.9% 8 61 62.3 contract 37.7 JV APMT 4.0% > 12 59 97.2 contract 2.8 V Evergreen HPH 12.2% 12 100.0 contract PSA 7.7% 3 6 55 100.0 contract Hapag-Lloyd PSA 9.8% 33 100.0 contract HPH 9.4% 3 4 100.0 contract DPW 6.3% 6 6 100.0 contract NYK 5.3% 9 18 100.0 contract SSA 4.0% 4 12 100.0 contract Coscon HPH 14.9% 5 64.0 contract 36.0 V PSA 11.0% 6 43 57.9 contract 42.1 JV SSA 4.4% 个 3 68.5 contract 31.5 JV APMT 3.4% 5 32 29.0 contract 71.0 JV Eurogate 3.3% 2 100.0 contract DPW 2.9% 20 39.7 contract 60.3 IV China Shipping HPH 14.9% 11 2 100.0 contract PSA 9.2% 2 100.0 contract SSA 4.2% 2 5 7 100.0 contract Cosco 4.0% 37 100.0 contract APL PSA 14.6% 3 7 3 100.0 contract HPH 9.7% 36 100.0 contract DPW 8.7% 14 2 95.7 contract 4.3 V Hanjin HPH 13.6% 5 13 48 100.0 contract PSA 9.0% 2 3 21 100.0 contract Eurogate 4.1% 13 100.0 contract DPW 3.4% 13 21 96.9 contract 3.1 JV NYK DPW 7.9% 6 15 7 100.0 contract PSA 7.9% J 18 100.0 contract HPH 4.0% 9 100.0 contract HHLA 3.8% 2 > 100.0 contract CMH 3.2% 4 15 100.0 contract OOCL PSA 10.1% 2 23 100.0 contract HPH 8.8% 45 10 32 100.0 contract DPW 7.3% 3 CMH 5.8% 2 100.0 contract 100.0 contract Wharf H. 4.9% 12 100.0 contract (continued on next page)Appendix 3. Major suppliers/partners of shipping lines in port operations: WCTC relevance, geographical coverage and forms of cooperation (2006 data) Carrier Major suppliers and partners WCTC share (%) Number of regions Number of ports Number of weekly calls Forms of co-operation (WCTC % split) Maersk HPH 5.7% 5 12 57 80.0 contract 20.0 JV PSA 5.2% 4 6 26 86.0 contract 14.0 JV DPW 3.3% 4 11 33 86.3 contract 13.7 JV Eurogate 2.8% 2 7 42 26.8 contract 73.2 JV MSC HPH 9.6% 6 13 60 100.0 contract PSA 7.8% 3 8 49 56.8 contract 43.2 JV DPW 5.0% 8 16 45 100.0 contract Eurogate 3.9% 2 5 31 55.3 contract 44.7 JV CMA–CGM HPH 11.1% 4 16 76 100.0 contract PSA 8.2% 4 8 39 85.4 contract 14.6 JV DPW 5.9% 8 17 61 62.3 contract 37.7 JV APMT 4.0% 7 17 59 97.2 contract 2.8 JV Evergreen HPH 12.2% 4 12 85 100.0 contract PSA 7.7% 3 6 55 100.0 contract Hapag–Lloyd PSA 9.8% 4 6 33 100.0 contract HPH 9.4% 4 13 47 100.0 contract DPW 6.3% 6 15 61 100.0 contract NYK 5.3% 3 9 18 100.0 contract SSA 4.0% 1 4 12 100.0 contract Coscon HPH 14.9% 4 12 75 64.0 contract 36.0 JV PSA 11.0% 3 6 43 57.9 contract 42.1 JV SSA 4.4% 1 3 5 68.5 contract 31.5 JV APMT 3.4% 5 8 32 29.0 contract 71.0 JV Eurogate 3.3% 1 2 4 100.0 contract DPW 2.9% 3 5 20 39.7 contract 60.3 JV China Shipping HPH 14.9% 3 11 62 100.0 contract PSA 9.2% 3 5 22 100.0 contract SSA 4.2% 2 5 7 100.0 contract Cosco 4.0% 2 7 37 100.0 contract APL PSA 14.6% 3 7 33 100.0 contract HPH 9.7% 4 13 36 100.0 contract DPW 8.7% 5 14 25 95.7 contract 4.3 JV Hanjin HPH 13.6% 5 13 48 100.0 contract PSA 9.0% 2 3 21 100.0 contract Eurogate 4.1% 2 3 13 100.0 contract DPW 3.4% 5 13 21 96.9 contract 3.1 JV NYK DPW 7.9% 6 15 27 100.0 contract PSA 7.9% 3 5 18 100.0 contract HPH 4.0% 4 9 21 100.0 contract HHLA 3.8% 2 2 7 100.0 contract CMH 3.2% 1 4 15 100.0 contract OOCL PSA 10.1% 2 4 23 100.0 contract HPH 8.8% 4 10 32 100.0 contract DPW 7.3% 5 17 38 100.0 contract CMH 5.8% 1 5 24 100.0 contract Wharf H. 4.9% 1 2 12 100.0 contract (continued on next page) M. Soppé et al. / Journal of Transport Geography 17 (2009) 10–20 19