正在加载图片...

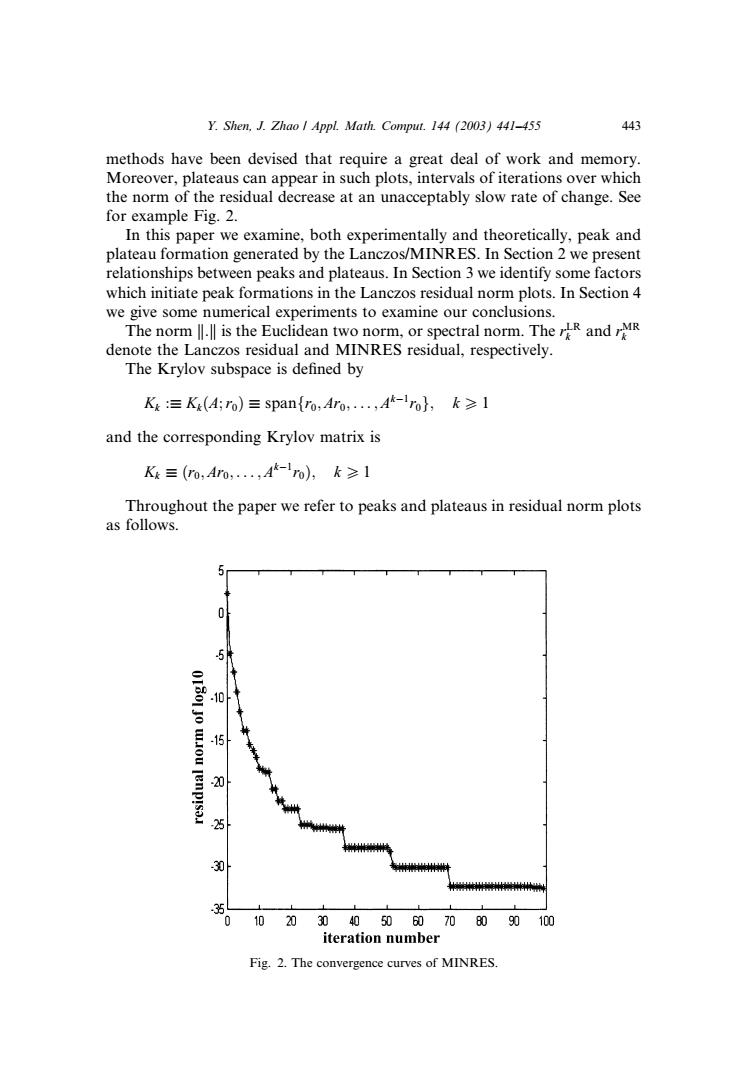
Y.Shen,J.Zhao Appl.Math.Comput.144 (2003)441-455 443 methods have been devised that require a great deal of work and memory Moreover,plateaus can appear in such plots,intervals of iterations over which the norm of the residual decrease at an unacceptably slow rate of change.See for example Fig.2. In this paper we examine,both experimentally and theoretically,peak and plateau formation generated by the Lanczos/MINRES.In Section 2 we present relationships between peaks and plateaus.In Section 3 we identify some factors which initiate peak formations in the Lanczos residual norm plots.In Section 4 we give some numerical experiments to examine our conclusions. The norm is the Euclidean two norm,or spectral norm.The and denote the Lanczos residual and MINRES residual,respectively. The Krylov subspace is defined by K三Ke(4ro)三span{o,Aro,,A-o,k≥1 and the corresponding Krylov matrix is K≡(m,A0,,A-1o),k≥1 Throughout the paper we refer to peaks and plateaus in residual norm plots as follows. 0 20 3 0102030405060708090100 iteration number Fig.2.The convergence curves of MINRES.methods have been devised that require a great deal of work and memory. Moreover, plateaus can appear in such plots, intervals of iterations over which the norm of the residual decrease at an unacceptably slowrate of change. See for example Fig. 2. In this paper we examine, both experimentally and theoretically, peak and plateau formation generated by the Lanczos/MINRES. In Section 2 we present relationships between peaks and plateaus. In Section 3 we identify some factors which initiate peak formations in the Lanczos residual norm plots. In Section 4 we give some numerical experiments to examine our conclusions. The norm k:k is the Euclidean two norm, or spectral norm. The rLR k and rMR k denote the Lanczos residual and MINRES residual, respectively. The Krylov subspace is defined by Kk : Kk ðA;r0Þ spanfr0; Ar0; ... ; Ak1 r0g; k P 1 and the corresponding Krylov matrix is Kk ðr0; Ar0; ... ; Ak1 r0Þ; k P1 Throughout the paper we refer to peaks and plateaus in residual norm plots as follows. Fig. 2. The convergence curves of MINRES. Y. Shen, J. Zhao / Appl. Math. Comput. 144 (2003) 441–455 443